Answered step by step
Verified Expert Solution
Question
1 Approved Answer
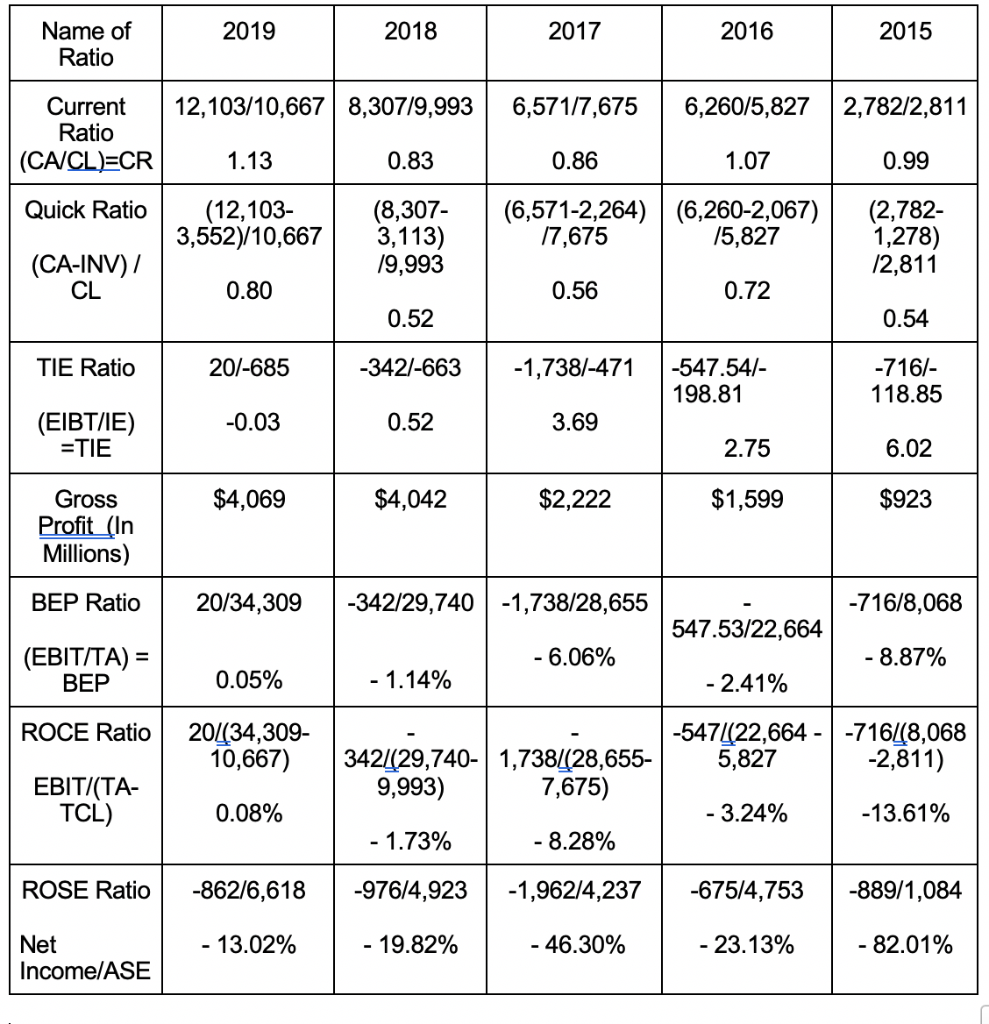
Tesla Company Financial performance According to Ratio Analysis how is your company performing? 2019 2018 2017 2016 2015 Name of Ratio 12,103/10,667 8,307/9,993 6,571/7,675 6,260/5,827

Tesla Company Financial performance
According to Ratio Analysis how is your company performing?
2019 2018 2017 2016 2015 Name of Ratio 12,103/10,667 8,307/9,993 6,571/7,675 6,260/5,827 2,782/2,811 Current Ratio (CA/CL)=CR 1.13 0.83 0.86 1.07 0.99 Quick Ratio (12,103- 3,552)/10,667 (8,307- 3,113) 19,993 (6,571-2,264) (6,260-2,067) 17,675 15,827 (2,782- 1,278) 12,811 (CA-INV)/ CL 0.80 0.56 0.72 0.52 0.54 TIE Ratio 20/-685 -342/-663 -1,738/-471 -547.541- 198.81 -716/- 118.85 -0.03 0.52 3.69 (EIBT/IE) =TIE 2.75 6.02 $4,069 $4,042 $2,222 $1,599 $923 Gross Profit_(In Millions) BEP Ratio 20/34,309 -342/29,740 -1,738/28,655 -716/8,068 547.53/22,664 - 6.06% - 8.87% (EBIT/TA) = BEP 0.05% - 1.14% - 2.41% ROCE Ratio 20/134,309- 10,667) 342/(29,740- 1,738/(28,655- 9,993) 7,675) -547/(22,664 - -716448,068 5,827 -2,811) EBIT/(TA- TCL) 0.08% - 3.24% -13.61% - 1.73% -8.28% ROSE Ratio -862/6,618 -976/4,923 -1,962/4,237 -675/4,753 -889/1,084 - 13.02% 19.82% - 46.30% - 23.13% - 82.01% Net Income/ASEStep by Step Solution
There are 3 Steps involved in it
Step: 1

Get Instant Access to Expert-Tailored Solutions
See step-by-step solutions with expert insights and AI powered tools for academic success
Step: 2

Step: 3

Ace Your Homework with AI
Get the answers you need in no time with our AI-driven, step-by-step assistance
Get Started


