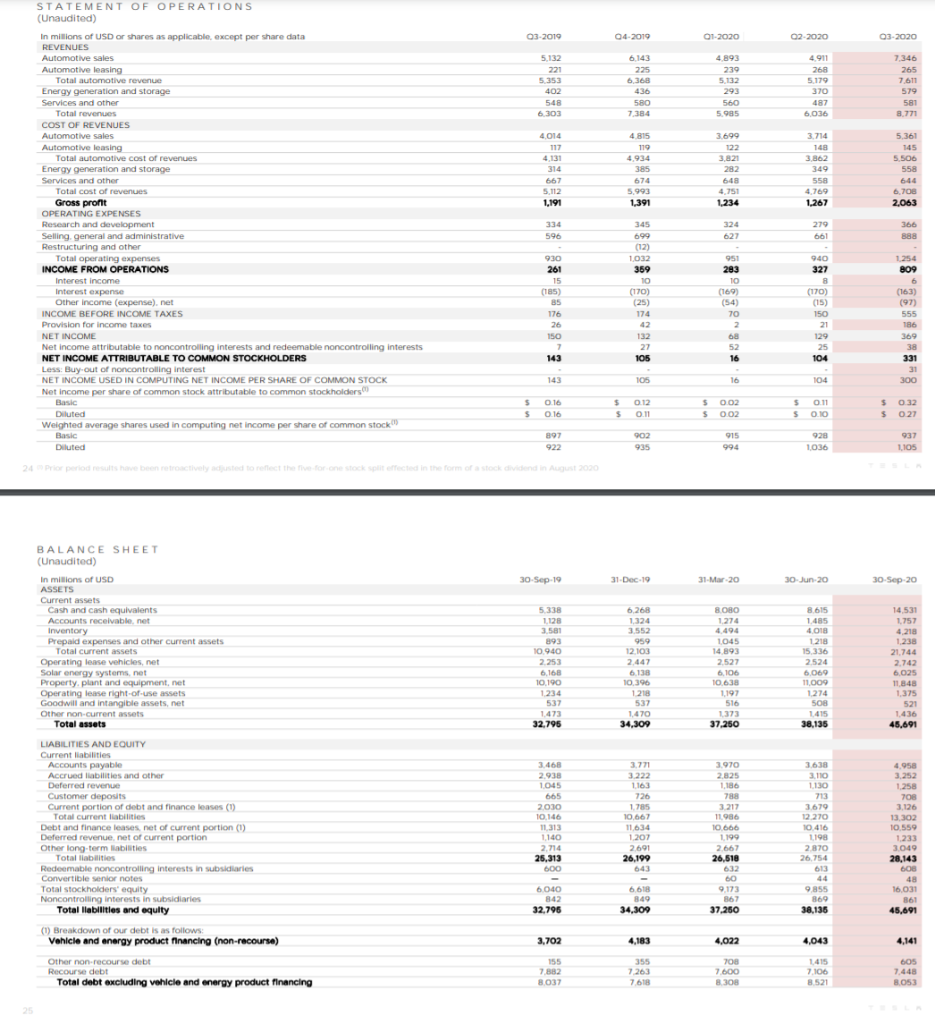
Tesla Q3 2019 and Q3 2020
Information needed:
I need answers for teslas using the Q3 2020 and 2019;
working capital, current ratio, receivables turnover, average collection period, inventory turnover, days in turnover, gross profit margin, profit margin, asset turnover, the return of assets, return on common shareholders equity, basic earnings per share.
Here is the data for tesla;
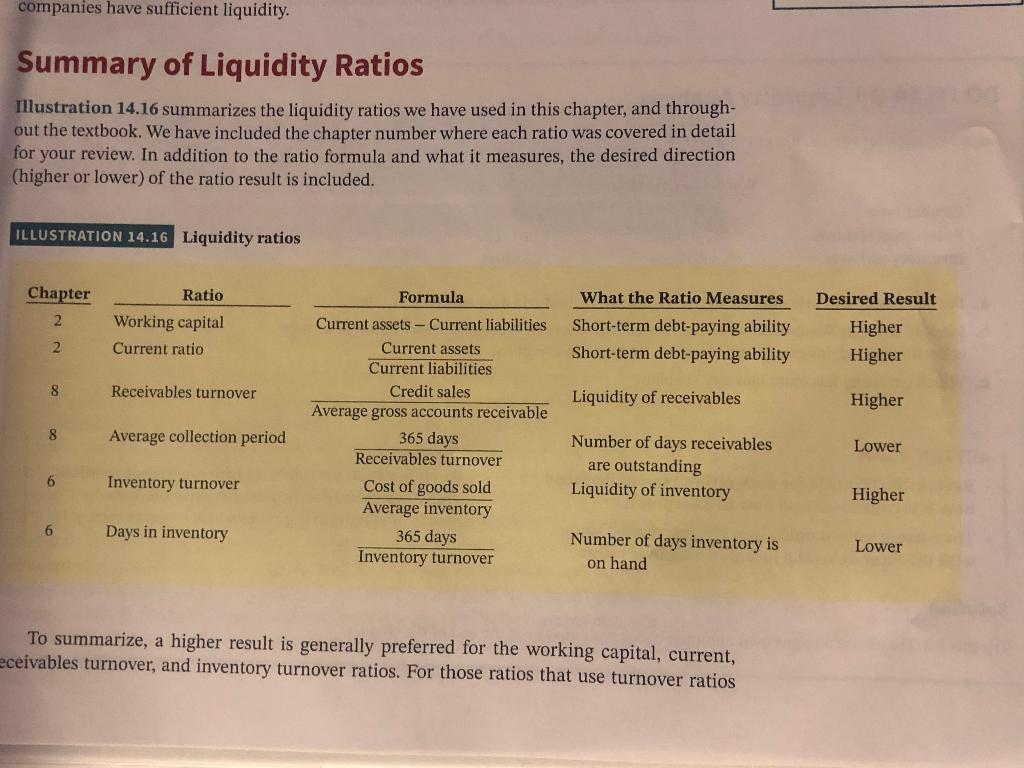
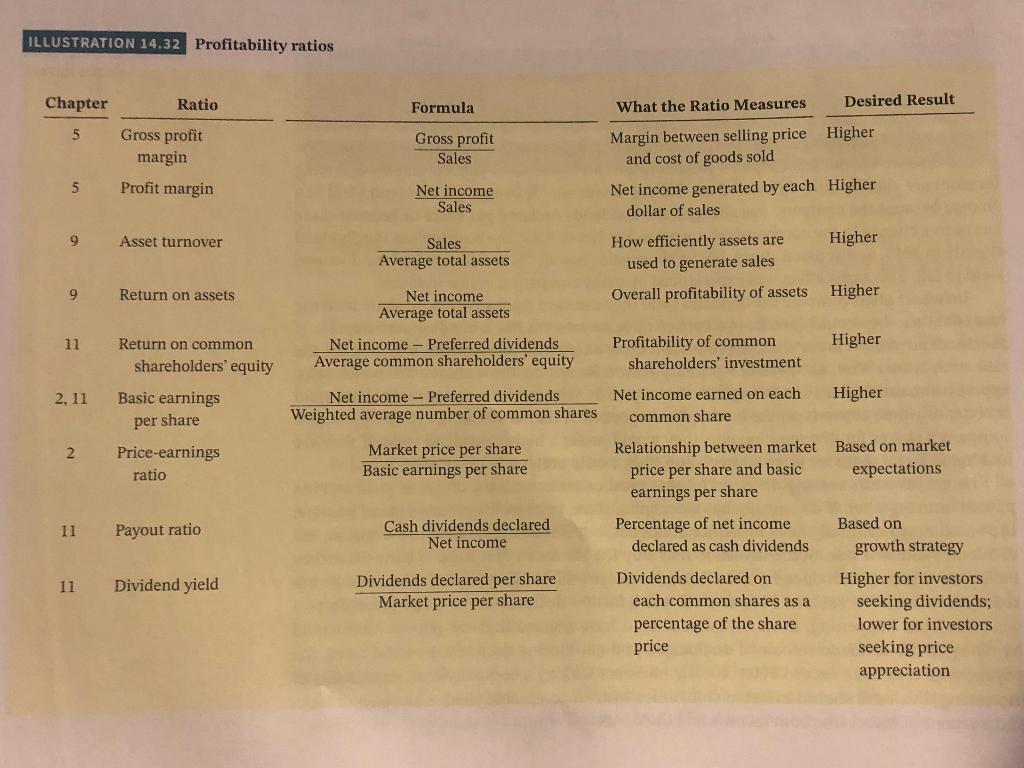
companies have sufficient liquidity. Summary of Liquidity Ratios Illustration 14.16 summarizes the liquidity ratios we have used in this chapter, and through- out the textbook. We have included the chapter number where each ratio was covered in detail for your review. In addition to the ratio formula and what it measures, the desired direction (higher or lower) of the ratio result is included. ILLUSTRATION 14.16 Liquidity ratios Ratio Chapter 2 Working capital Current ratio What the Ratio Measures Short-term debt-paying ability Short-term debt-paying ability Desired Result Higher Higher 2 8 Receivables turnover Liquidity of receivables Higher Formula Current assets - Current liabilities Current assets Current liabilities Credit sales Average gross accounts receivable 365 days Receivables turnover Cost of goods sold Average inventory 365 days Inventory turnover 8 Average collection period Lower Number of days receivables are outstanding Liquidity of inventory 6 Inventory turnover Higher 6 Days in inventory Number of days inventory is Lower on hand To summarize, a higher result is generally preferred for the working capital, current, eceivables turnover, and inventory turnover ratios. For those ratios that use turnover ratios ILLUSTRATION 14.32 Profitability ratios Chapter Ratio Formula What the Ratio Measures Desired Result 5 Gross profit margin Gross profit Sales Margin between selling price Higher and cost of goods sold Net income generated by each Higher dollar of sales 5 Profit margin Net income Sales 9 Asset turnover Higher Sales Average total assets How efficiently assets are used to generate sales Overall profitability of assets 9 Return on assets Higher Net income Average total assets Net income - Preferred dividends Average common shareholders' equity 11 Higher Profitability of common shareholders' investment Return on common shareholders' equity Basic earnings 2, 11 Higher Net income - Preferred dividends Weighted average number of common shares Net income earned on each common share per share 2 Price-earnings ratio Market price per share Basic earnings per share 11 Payout ratio Cash dividends declared Net income Relationship between market Based on market price per share and basic expectations earnings per share Percentage of net income Based on declared as cash dividends growth strategy Dividends declared on Higher for investors each common shares as a seeking dividends; percentage of the share lower for investors price seeking price appreciation 11 Dividend yield Dividends declared per share Market price per share 03.2019 04-2019 01-2020 02-2020 03-2020 5.132 221 5.353 402 545 6 303 6143 225 6.368 436 580 7,384 4.893 239 5.132 293 560 5985 4911 268 5.179 370 487 6.036 7,346 265 7.611 579 581 8.771 4014 4.131 314 667 5,112 1.191 4 815 119 4,934 385 674 5.993 1,391 3.699 122 3.821 282 649 4.751 1,234 3.714 148 3,862 349 558 4,769 1.267 5.361 145 5.506 558 644 6.700 2,063 STATEMENT OF OPERATIONS (Unaudited) In millions of USD or shares as applicable, except per share data REVENUES Automotive Sales Automotive leasing Total automotive revenue Energy generation and storage Services and other Total revenues COST OF REVENUES Automotive sales Automotive leasing Total automotive cost of revenues Energy generation and storage Services and other Total cost of revenues Gross pront OPERATING EXPENSES Research and development Selling general and administrative Restructuring and other Total operating expenses INCOME FROM OPERATIONS Interest income Interest expense Other Income (expense). net INCOME BEFORE INCOME TAXES Provision for income taxes NET INCOME Net income attributable to noncontrolling interests and redeemable noncontrolling interests NET INCOME ATTRIBUTABLE TO COMMON STOCKHOLDERS Less: Buy out of noncontrolling interest NET INCOME USED IN COMPUTING NET INCOME PER SHARE OF COMMON STOCK Net Income per share of common stock attributable to common stockholders Basic Diluted Weighted average shares used in computing net income per share of common stock Basic Diluted 334 596 324 627 279 661 366 888 345 699 (12 1032 359 10 (170) (25) 174 930 261 15 (185) 85 176 26 150 7 143 809 951 283 10 (169) (54) 70 940 327 8 (170) (15) 150 21 129 25 104 132 27 105 68 52 16 (163) (97) 555 186 369 38 331 31 300 143 105 16 104 0.16 0.16 $ $ 0.12 0.11 $ $ 0.02 0.02 $ 0.11 $ 0.10 $ 0.32 $ 0.27 $ 897 922 902 935 915 994 928 1036 937 1105 24 Prilor period results have been retroactively adjusted to reflect the five for one stock split effected in the form of a stock dividend in August 2020 BALANCE SHEET (Unaudited) In millions of USD 30-Sep-19 31 Dec 19 31-Mar-20 30-Jun-20 30-Sep-20 osep 2 ASSETS Current assets Cash and cash equivalents Accounts receivable.net Inventory Prepaid expenses and other current assets Total current assets Operating lase vehicles, net Solar energy systems, net Property, plant and equipment, net Operating lease right-of-use assets Goodwill and intangible assets, net Other non-current assets Total assets 5.338 1128 3.581 893 10.940 2 253 6.16 10.190 1.234 537 1.473 32.796 6.268 1.324 3552 959 12.103 2.447 6.138 10.396 1218 537 1.470 34,309 BOBO 1274 4.494 1045 14 893 2.527 6.106 10.63 1,197 516 1373 37,250 8.615 1.485 4018 1218 15,336 2.524 6.069 11.00 1274 508 1.415 38,135 14,531 1,757 4.218 1.238 21.744 2.742 6.025 11.848 1.375 521 1.436 45,691 LIABILITIES AND EQUITY Current liabilities Accounts payable Accrued liabilities and other Deferred revenue Customer deposits Current portion of debt and finance leases (1) Total current liabilities Debt and finance leases.net of current portion (1) Deferred revenue, net of current portion Other long-term liabilities Total liabilities Redeemable no controlling interests in subsidiaries Convertible senior notes Total stockholders' equity Noncontrolling interests in subsidiaries Total liabilities and equity 3.468 2.938 1.045 665 2030 10.146 11,313 1.140 2,714 26,313 600 3.771 3.222 1.163 726 1.785 10.667 11,634 1.207 2691 26,199 643 3.970 2.825 1,186 788 3.217 11.986 10.666 1199 2.667 26,618 632 60 9173 867 37,250 3,638 3.110 1130 713 3.679 12.270 10.416 1198 2870 26.754 613 3.252 1.258 700 3.126 13.302 10.559 1.233 3049 28.143 608 48 16031 361 45,691 6040 842 32,796 6.618 849 34,309 9,855 869 38,135 (1) Breakdown of our debt is as follows: Vehicle and energy product financing (non-recourse) 3,702 4,183 4,022 4,043 4,141 605 Other non-recourse debt Recourse debt Total debt excluding vehicle and energy product financing 155 7.882 8037 355 7.263 7618 708 7.600 1415 7,106 8521 8053