Answered step by step
Verified Expert Solution
Question
1 Approved Answer
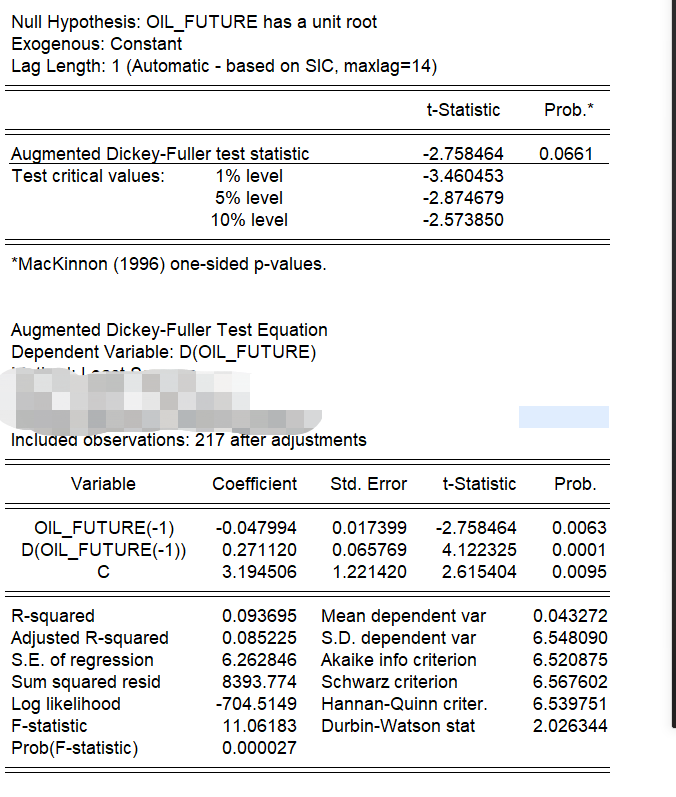
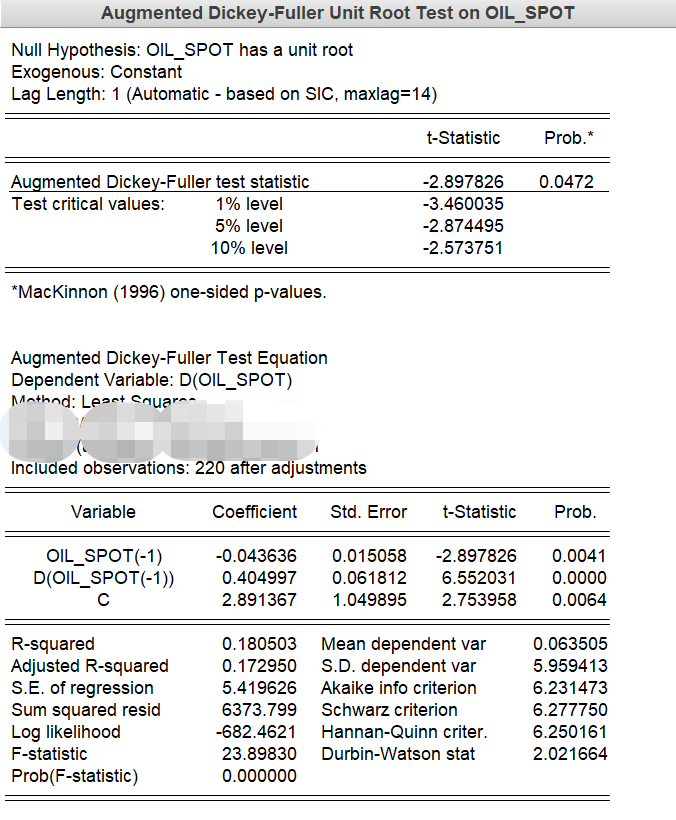
Test whether the series are stationary and explain the concept of cointegration in the context of these series Null Hypothesis: OIL_FUTURE has a unit root
Test whether the series are stationary and explain the concept of cointegration in the context of these series
Null Hypothesis: OIL_FUTURE has a unit root Exogenous: Constant Lag Length: 1 (Automatic - based on SIC, maxlag=14) t-Statistic Prob.* 0.0661 Augmented Dickey-Fuller test statistic Test critical values: 1% level 5% level 10% level -2.758464 -3.460453 -2.874679 -2.573850 *MacKinnon (1996) one-sided p-values. Augmented Dickey-Fuller Test Equation Dependent Variable: D(OIL_FUTURE) Included observations: 217 after adjustments Variable Coefficient Std. Error t-Statistic Prob. OIL_FUTURE(-1) D(OIL_FUTURE(-1)) -0.047994 0.271120 3.194506 0.017399 0.065769 1.221420 -2.758464 4.122325 2.615404 0.0063 0.0001 0.0095 R-squared Adjusted R-squared S.E. of regression Sum squared resid Log likelihood F-statistic Prob(F-statistic) 0.093695 0.085225 6.262846 8393.774 -704.5149 11.06183 0.000027 Mean dependent var S.D. dependent var Akaike info criterion Schwarz criterion Hannan-Quinn criter. Durbin-Watson stat 0.043272 6.548090 6.520875 6.567602 6.539751 2.026344 Augmented Dickey-Fuller Unit Root Test on OIL_SPOT Null Hypothesis: OIL_SPOT has a unit root Exogenous: Constant Lag Length: 1 (Automatic - based on SIC, maxlag=14) t-Statistic Prob.* 0.0472 Augmented Dickey-Fuller test statistic Test critical values: 1% level 5% level 10% level -2.897826 -3.460035 -2.874495 -2.573751 *MacKinnon (1996) one-sided p-values. Augmented Dickey-Fuller Test Equation Dependent Variable: D(OIL_SPOT) Method: Leset Cnuara- Included observations: 220 after adjustments Variable Coefficient Std. Error t-Statistic Prob. OIL_SPOT(-1) D(OIL_SPOT(-1)) -0.043636 0.404997 2.891367 0.015058 0.061812 1.049895 -2.897826 6.552031 2.753958 0.0041 0.0000 0.0064 R-squared Adjusted R-squared S.E. of regression Sum squared resid Log likelihood F-statistic Prob(F-statistic) 0.180503 Mean dependent var 0.172950 S.D. dependent var 5.419626 Akaike info criterion 6373.799 Schwarz criterion -682.4621 Hannan-Quinn criter. 23.89830 Durbin-Watson stat 0.000000 0.063505 5.959413 6.231473 6.277750 6.250161 2.021664Step by Step Solution
There are 3 Steps involved in it
Step: 1

Get Instant Access to Expert-Tailored Solutions
See step-by-step solutions with expert insights and AI powered tools for academic success
Step: 2

Step: 3
Ace Your Homework with AI
Get the answers you need in no time with our AI-driven, step-by-step assistance
Get Started