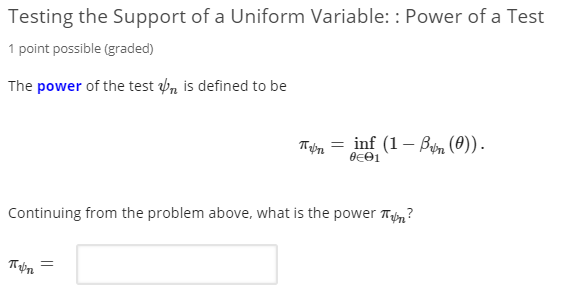

Testing the Support of a Uniform Variable: : Power of a Test 1 point possible (graded) The power of the test Un is defined to be Tron = inf (1 - Ben O)). dei Continuing from the problem above, what is the power Thym? Tin = As above, let X1,..., Xn tid Unif[0, 6] for an unknown parameter 6 and we designed the statistical test Un = 1(max Xi > 1/2) 1
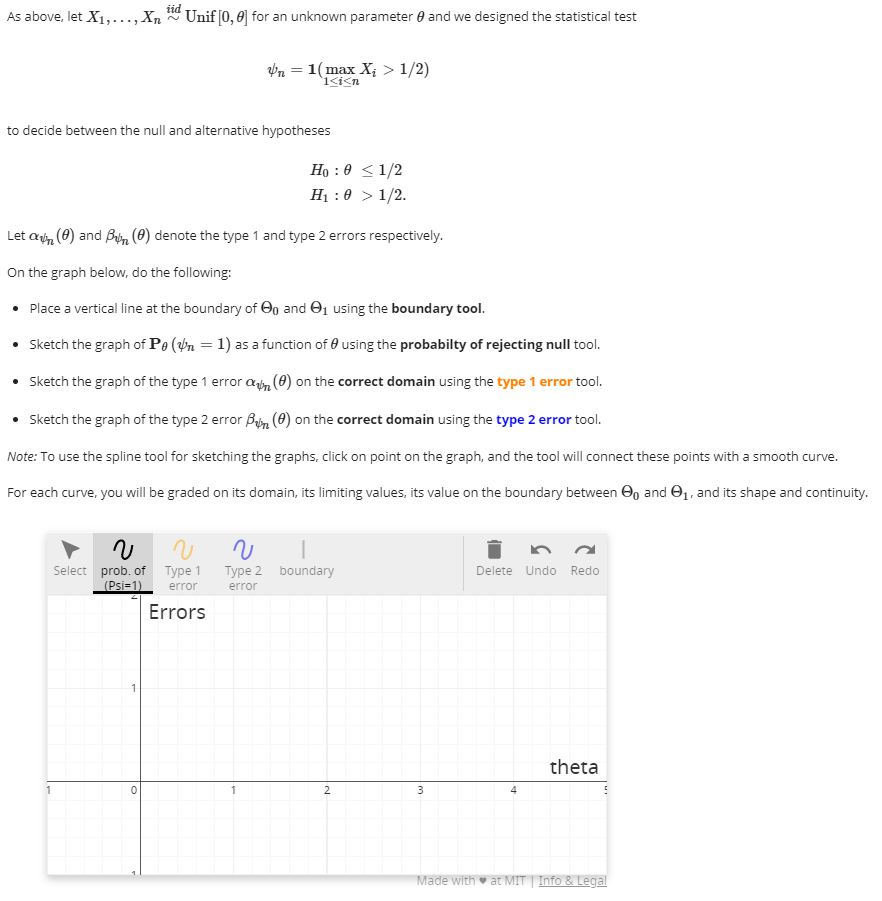
1/2. Let Olun ) and Bum ) denote the type 1 and type 2 errors respectively. On the graph below, do the following: Place a vertical line at the boundary of O, and 1 using the boundary tool. Sketch the graph of Pe (Un = 1) as a function of using the probabilty of rejecting null tool. Sketch the graph of the type 1 error on () on the correct domain using the type 1 error tool. Sketch the graph of the type 2 error Ben () on the correct domain using the type 2 error tool. Note: To use the spline tool for sketching the graphs, click on point on the graph, and the tool will connect these points with a smooth curve. For each curve, you will be graded on its domain, its limiting values, its value on the boundary between @ and @1, and its shape and continuity. V Select prob. of Type 1 (Psi=1) error Errors V Type 2 boundary Delete Undo Redo error 1 theta 0 2 3 Made with at MIT Info & Legal Testing the Support of a Uniform Variable: : Power of a Test 1 point possible (graded) The power of the test Un is defined to be Tron = inf (1 - Ben O)). dei Continuing from the problem above, what is the power Thym? Tin = As above, let X1,..., Xn tid Unif[0, 6] for an unknown parameter 6 and we designed the statistical test Un = 1(max Xi > 1/2) 1 1/2. Let Olun ) and Bum ) denote the type 1 and type 2 errors respectively. On the graph below, do the following: Place a vertical line at the boundary of O, and 1 using the boundary tool. Sketch the graph of Pe (Un = 1) as a function of using the probabilty of rejecting null tool. Sketch the graph of the type 1 error on () on the correct domain using the type 1 error tool. Sketch the graph of the type 2 error Ben () on the correct domain using the type 2 error tool. Note: To use the spline tool for sketching the graphs, click on point on the graph, and the tool will connect these points with a smooth curve. For each curve, you will be graded on its domain, its limiting values, its value on the boundary between @ and @1, and its shape and continuity. V Select prob. of Type 1 (Psi=1) error Errors V Type 2 boundary Delete Undo Redo error 1 theta 0 2 3 Made with at MIT Info & Legal


