.... Thanks.!
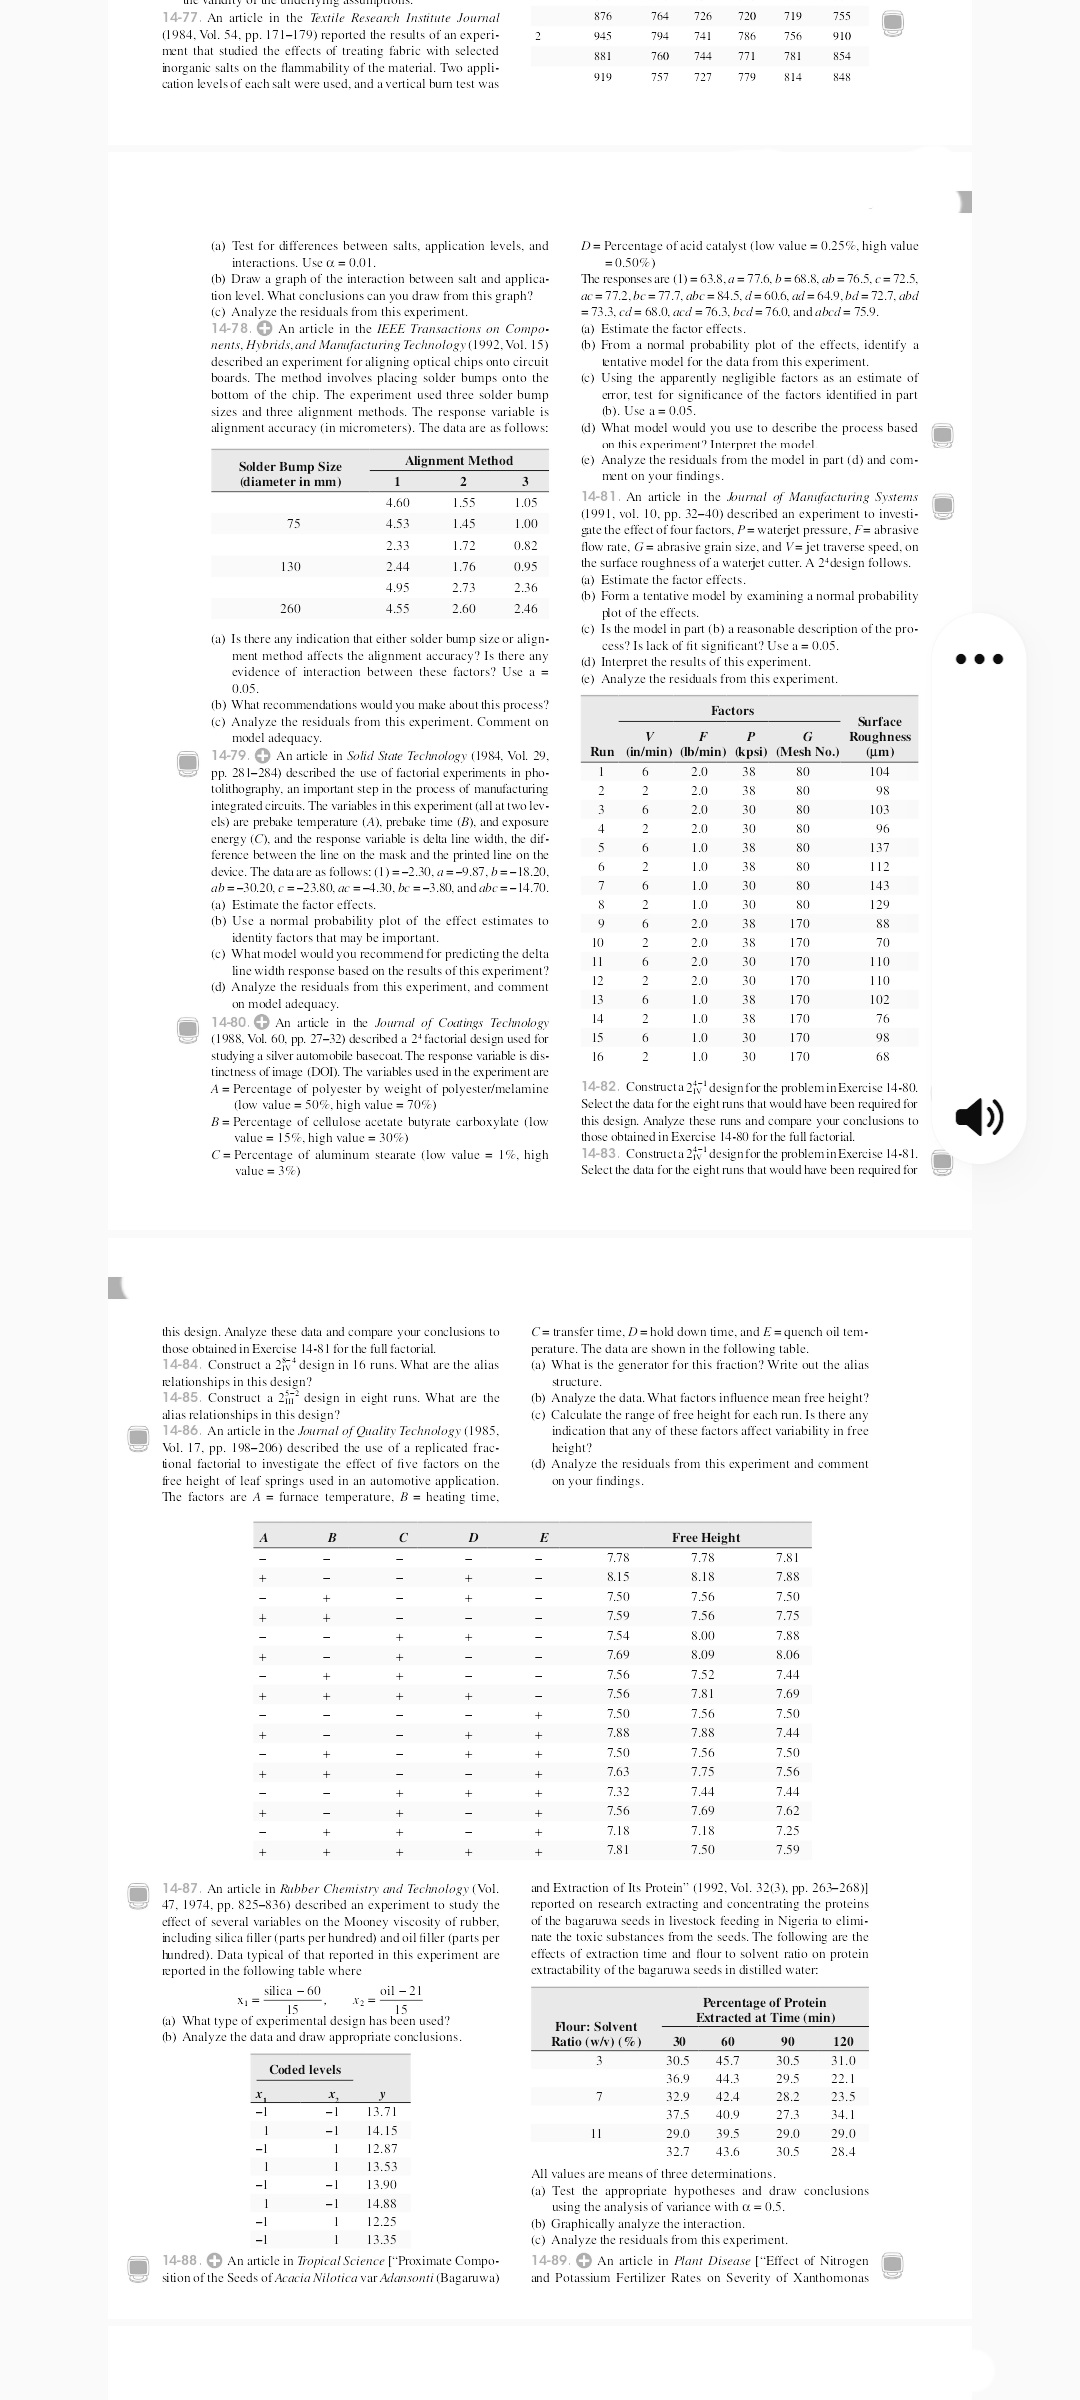
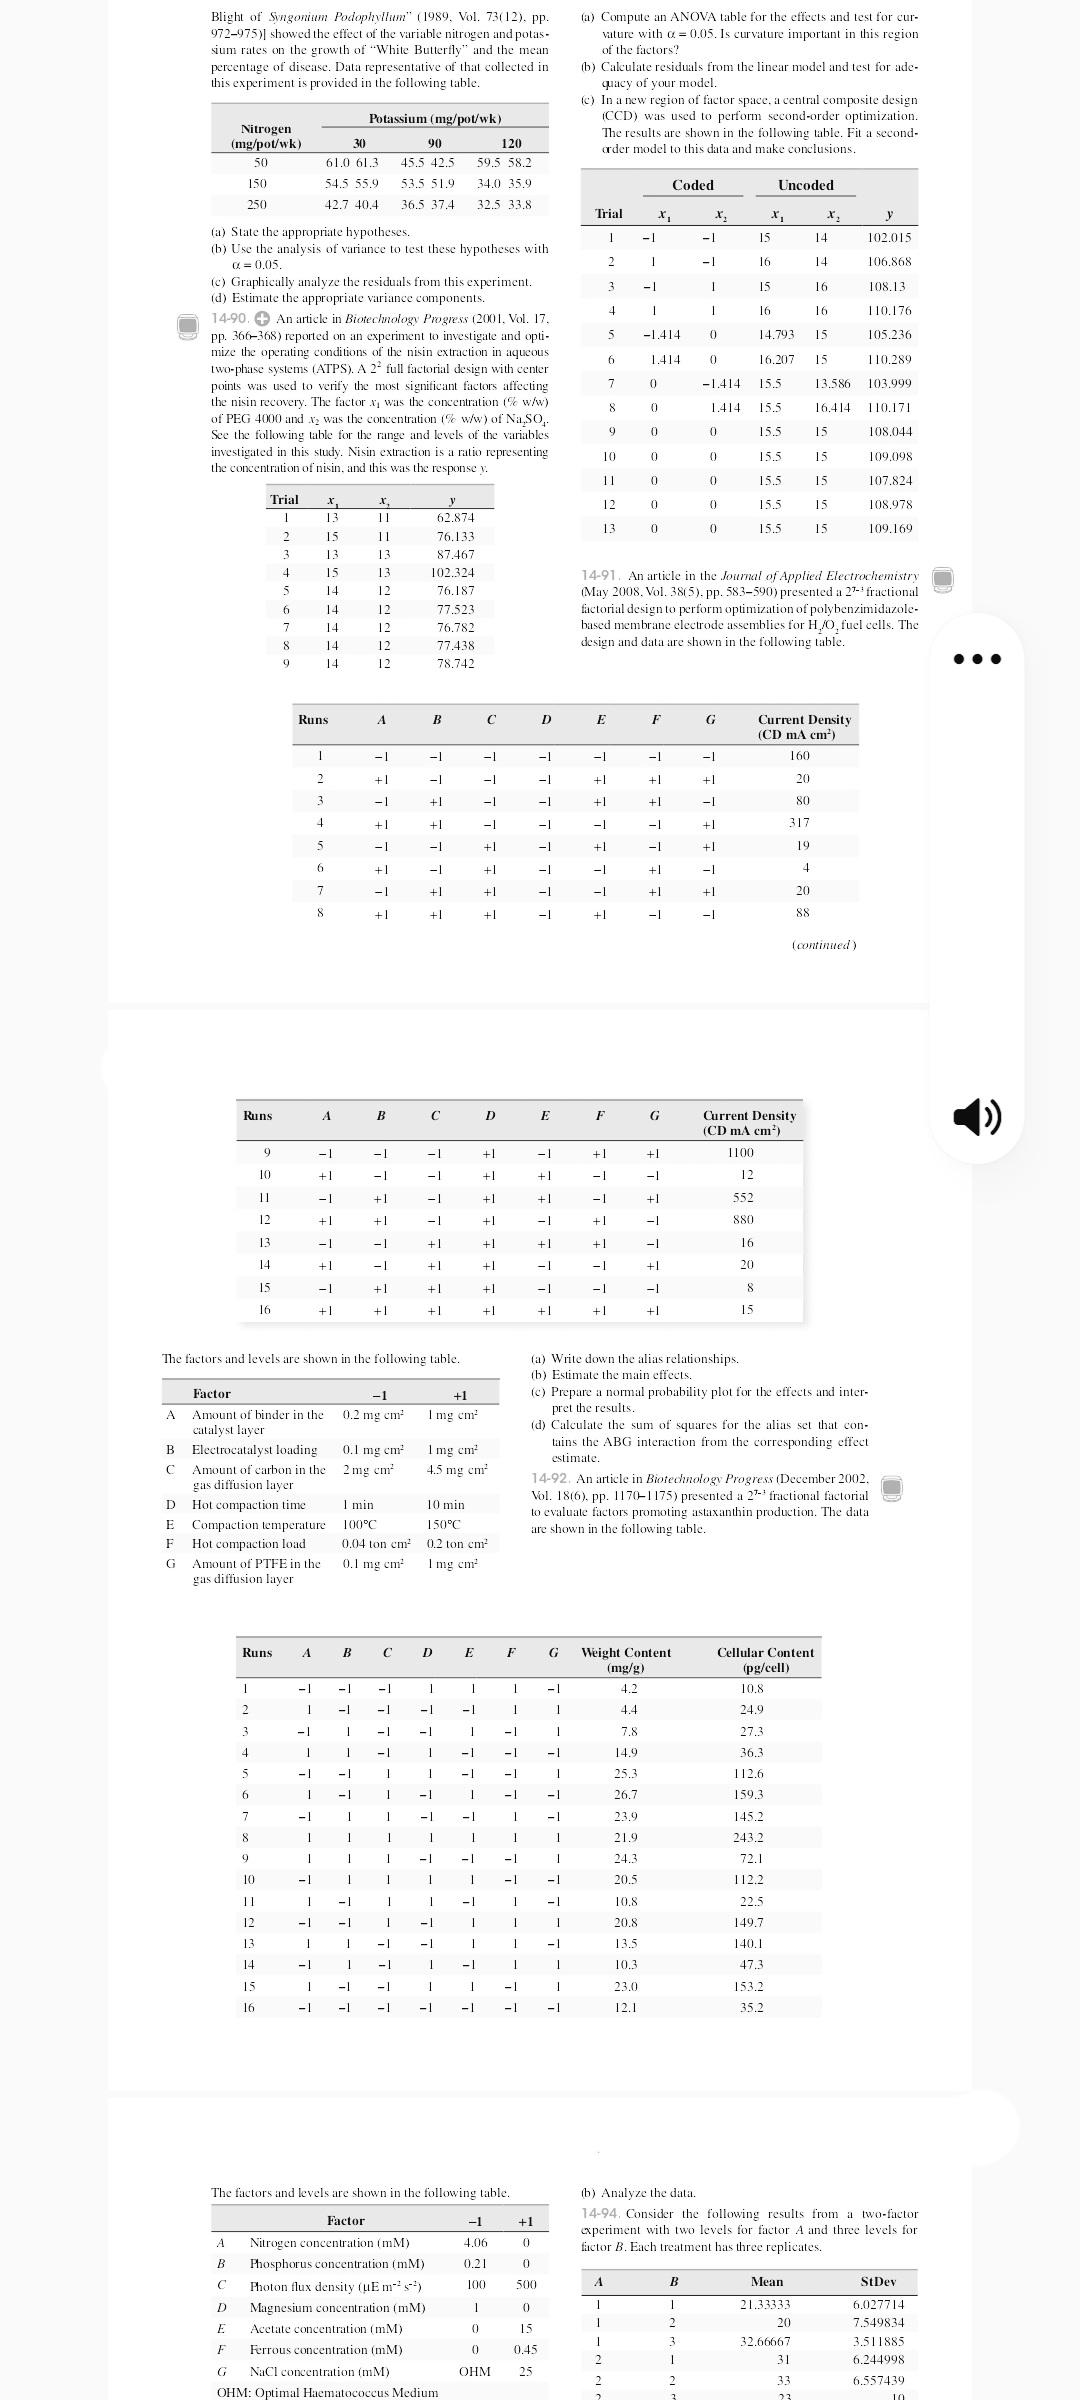
14-77. An article in the Textile Research Institute Journal 876 76- 726 719 (1984. Vol. 54. pp. 171-179) reported the results of an experi- 945 ment that studied the effects of treating fabric with selected 881 781 inorganic salts on the flammability of the material. Two appli- 919 757 727 814 cation levels of each salt were used, and a vertical burn test was (a) Test for differences between salts, application levels, and D = Percentage of acid catalyst (low value = 0.25%, high value interactions. Use a = 0.01. =0.50%) (b) Draw a graph of the interaction between salt and applica- The responses are (1) = 63.8.a = 77.6, b= 68.8, ab = 76.5. c= 72.5. tion level. What conclusions can you draw from this graph? ac = 17.2, be= 77.7, abc= 84.5. d=60.6. ad = 64.9. bd = 72.7. abd (c) Analyze the residuals from this experiment. =73.3, cd = 68.0. acd = 76.3. bed = 76.0, and abed = 75.9. 14-78. + An article in the IEEE Transactions on Compo- (a) Estimate the factor effects. nents, Hybrids, and Manufacturing Technology (1992. Vol. 15) (b) From a normal probability plot of the effects, identify a described an experiment for aligning optical chips onto circuit tentative model for the data from this experiment. boards. The method involves placing solder bumps onto the (c) Using the apparently negligible factors as an estimate of bottom of the chip. The experiment used three solder bump rror, test for significance of the factors identified in part sizes and three alignment methods. The response variable is (b). Use a = 0.05. alignment accuracy (in micrometers). The data are as follows: d) What model would you use to describe the process based on this experiment" Interpret the model Solder Bump Size Alignment Method (e) Analyze the residuals from the model in part (d) and com- diameter in mm) ment on your findings. 4.60 1.5 1.05 14-81. An article in the Journal of Manufacturing Systems (1991. vol. 10, pp. 32-40) described an experiment to investi- 75 4.53 1.4 1.00 gate the effect of four factors, P= waterjet pressure, F= abrasive 2.33 1.72 0.82 flow rate, G = abrasive grain size, and V= jet traverse speed, on 130 2.44 1,76 0.95 the surface roughness of a waterjet cutter. A 24 design follows. 4.95 2.73 2.36 (a) Estimate the factor effects. (b) Form a tentative model by examining a normal probability 260 1 55 2.60 2 46 plot of the effects. (a) Is there any indication that either solder bump size or align- (c) Is the model in part (b) a reasonable description of the pro- cess? Is lack of fit significant? Use a = 0.05. ment method affects the alignment accuracy? Is there any (d) Interpret the results of this experiment. . . . evidence of interaction between these factors? Use a = 0.05. e) Analyze the residuals from this experiment. (b) What recommendations would you make about this process? Factors (c) Analyze the residuals from this experiment. Comment on Surface model adequacy. Roughness 14-79. + An article in Solid State Technology (1984. Vol. 29. Run (in/min) (1b/min) (kpsi) (Mesh No.) (um) pp. 281-284) described the use of factorial experiments in pho- 2.0 38 80 104 tolithography, an important step in the process of manufacturing 2.0 38 8 98 integrated circuits. The variables in this experiment (all at two lev- 20 30 80 103 els) are prebake temperature (A), prebake time (B), and exposure 20 30 80 96 energy (C). and the response variable is delta line width, the dif- NON 1.0 38 ference between the line on the mask and the printed line on the 80 137 device. The data are as follows: (1)=-2.30, a=-9.87, b=-18.20. LO 38 80 112 ab =-30.20. c=-23.80, ac =-4.30. be =-3.80, and abc =-14.70. 1.0 30 80 143 (a) Estimate the factor effects. 1.0 30 80 129 b) Use a normal probability plot of the effect estimates to 6 2.0 38 170 identity factors that may be important. 10 2 2.0 38 170 70 (c) What model would you recommend for predicting the delta 6 2.0 170 1 10 line width response based on the results of this experiment? 11 30 (d) Analyze the residuals from this experiment, and comment 2.0 30 170 110 on model adequacy. 13 1.0 38 170 102 14-80. + An article in the Journal of Coatings Technology 14 1.0 NONGI 38 170 76 (1988. Vol. 60. pp. 27-32) described a 24 factorial design used for 15 1.0 30 170 98 studying a silver automobile basecoat. The response variable is dis- 16 LO 30 170 inetness of image (DOD). The variables used in the experiment are A = Percentage of polyester by weight of polyester/melamine 14-82. Constructa 2j' design for the problem in Exercise 14-80. (low value = 50%, high value = 70%) Select the data for the eight runs that would have been required for B = Percentage of cellulose acetate butyrate carboxylate (low this design. Analyze these runs and compare your conclusions to value = 15%, high value = 30%) those obtained in Exercise 14-80 for the full factorial. C = Percentage of aluminum stearate (low value = 1%. high 14-83. Constructa 21v' design for the problem in Exercise 14-81. value = 3%) Select the data for the eight runs that would have been required for this design. Analyze these data and compare your conclusions to C= transfer time. D = hold down time, and E = quench oil tem- those obtained in Exercise 14-81 for the full factorial. perature. The data are shown in the following table. 14-84. Construct a 27v" design in 16 runs. What are the alias (a) What is the generator for this fraction? Write out the alias elationships in this design? structure. 14-85, Construct a 2ini design in eight runs. What are the (b) Analyze the data. What factors influence mean free height? alias relationships in this design? (c) Calculate the range of free height for each run. Is there any 14-86. An article in the Journal of Quality Technology (1985. indication that any of these factors affect variability in free Vol. 17, pp. 198-206) described the use of a replicated frac- height? tional factorial to investigate the effect of five factors on the d) Analyze the residuals from this experiment and comment free height of leaf springs used in an automotive application. on your findings. The factors are A = furnace temperature, B = heating time. B D Free Height 7.7 7.78 7.81 81 3.18 7.88 7.50 7.56 7.50 7.50 7.56 7.75 7.54 8.00 7.88 7.69 8.09 8.06 7.5 7.52 7.44 7.56 7.81 7.69 7.50 7.56 7.50 7.8 7.88 7.44 7.50 7.56 750 7.6 7.75 7.56 7.32 7.44 7.44 7.56 7.69 7.62 7.18 7.18 7.25 7.81 7.50 759 14-87. An article in Rubber Chemistry and Technology (Vol. and Extraction of Its Protein" (1992. Vol. 32(3), pp. 263-268)] 47. 1974. pp. 825-836) described an experiment to study the reported on research extracting and concentrating the proteins effect of several variables on the Mooney viscosity of rubber. of the bagaruwa seeds in livestock feeding in Nigeria to climi- including silica filler (parts per hundred) and oil filler (parts per nate the toxic substances from the seeds. The following are the hundred). Data typical of that reported in this experiment are effects of extraction time and flour to solvent ratio on protein reported in the following table where extractability of the bagaruwa seeds in distilled water: Silica - 60 oil - 21 15 12 = - 15 Percentage of Protein (a) What type of experimental design has been used? Flour: Solvent Extracted at Time (min) (b) Analyze the data and draw appropriate conclusions. Ratio (w/v) (%) 30 60 90 120 30.5 45.7 30.5 Coded levels 31.0 36.9 44.3 29.5 22.1 32.9 42 4 28.2 23.5 -1 13.71 37.5 109 27.3 341 -1 14.15 290 39.5 290 29.0 12.87 32.7 43.6 30.5 28.4 13.53 -1 All values are means of three determinations. 13.90 a) Test the appropriate hypotheses and draw conclusions 14.88 using the analysis of variance with a = 0.5. 12.25 (b) Graphically analyze the interaction. 13.35 (c) Analyze the residuals from this experiment. 14-88. + An article in Tropical Science [ Proximate Compo- 14-89. + An article in Plant Disease ["Effect of Nitrogen sition of the Seeds of Acacia Nilotica var Adansonti (Bagaruwa) and Potassium Fertilizer Rates on Severity of XanthomonasBlight of Singonium Podophyllum" (1989, Vol. 73(12), pp. (a) Compute an ANOVA table for the effects and test for cur- 972-975)] showed the effect of the variable nitrogen and potas- vature with a = 0.05. Is curvature important in this region sium rates on the growth of "White Butterfly" and the mean of the factors? percentage of disease. Data representative of that collected in (b) Calculate residuals from the linear model and test for ade- his experiment is provided in the following table. quacy of your model. (c) In a new region of factor space, a central composite design Potassium (mg/pot/wk) (CCD) was used to perform second-order optimization Nitrogen The results are shown in the following table. Fit a second- (mg/pot/wk) 30 90 120 order model to this data and make conclusions. 50 61.0 61.3 45.5 42.5 59.5 58.2 150 54.5 55.9 53.5 51.9 34.0 35.9 Coded Uncoded 250 42.7 40.4 36.5 37.4 32.5 33.8 Trial (@) State the appropriate hypotheses. -1 15 14 102.015 (b) Use the analysis of variance to test these hypotheses with 0 = 0.05. 16 14 106.868 (c) Graphically analyze the residuals from this experiment. w 15 16 108.13 (d) Estimate the appropriate variance components. 16 14-90. + An article in Biotechnology Progress (2001, Vol. 17. 16 1 10.176 pp. 366-368) reported on an experiment to investigate and opti- -1.414 0 14.793 15 105.236 mize the operating conditions of the nisin extraction in aqueous 1.414 0 16.207 15 110.289 two-phase systems (ATPS). A 2" full factorial design with center points was used to verify the most significant factors affecting - -1.414 15.5 13.586 103.999 the nisin recovery. The factor .x, was the concentration (To w/w) 1.414 15.5 16.414 110.171 of PEG 4000 and x, was the concentration (To w/w) of Na,SO,. See the following table for the range and levels of the variables 0 15.5 08.044 investigated in this study. Nisin extraction is a ratio representing 10 0 0 15.5 109.098 the concentration of nisin, and this was the response y. 11 0 15.5 15 07.824 Trial 12 0 15.5 15 108.978 13 11 62.874 15 155 15 11 76.13 09.169 13 13 87.467 15 JOVITWI 13 102.324 14-91. An article in the Journal of Applied Electrochemistry 14 76.187 (May 2008. Vol. 38(5). pp. 583-590) presented a 23-3 fractional 14 77.523 factorial design to perform optimization of polybenzimidazole- 14 76.78. based membrane electrode assemblies for HO, fuel cells. The 14 77.438 design and data are shown in the following table. 78.742 . . . Runs A B C D E F G Current Density (CD mA em') -1 160 EL 20 80 317 19 Lit. 20 L ! (continued ) Runs A B C D E F G Current Density (CD mA em') 100 352 880 16 20 8 16 15 The factors and levels are shown in the following table. (a) Write down the alias relationships. (b) Estimate the main effects. Factor +1 (c) Prepare a normal probability plot for the effects and inter- A Amount of binder in the 0.2 mg cm I mg cm pret the results. catalyst layer (d) Calculate the sum of squares for the alias set that con- B Electrocatalyst loading 0. 1 mg cm Img cm- tains the ABG interaction from the corresponding effect estimate. Amount of carbon in the 2mg cm 4.5 mg cm gas diffusion layer 14-92. An article in Biotechnology Progress (December 2002. Hot compaction time Vol. 18(6), pp. 1170-1 175) presented a 2"- fractional factorial D I min 10 mir to evaluate factors promoting astaxanthin production. The data E Compaction temperature 100 0 150 C are shown in the following table. E Hot compaction load 0.04 ton cm' 0.2 ton cm Amount of PTFE in the 0.1 mg cm Img cm gas diffusion layer Runs A B C D E F G Weight Content Cellular Content (mg/g) (pg/cell) -1 4.2 10.8 4.4 24.9 7.8 27.3 149 36. 25.3 1 12.6 26.7 159.3 23.9 145.2 21.9 243.2 24.3 72.1 20.5 112.2 10.8 22.5 20.8 149.7 13.5 140.1 103 47.3 23.0 153.2 12.1 35.2 The factors and levels are shown in the following table. (b) Analyze the data. Factor -1 +1 14-94. Consider the following results from a two-factor experiment with two levels for factor A and three levels for A Nitrogen concentration (mM) 4.06 factor B. Each treatment has three replicates. B Phosphorus concentration (mM) 0.21 0 C Photon flux density (UE mo's"- ) 100 500 A B Mean StDev D Magnesium concentration (mM) 0 21.33333 6.027714 F Acctate concentration (mM) 15 20 7.549834 - WN - E Ferrous concentration (mM) 32.66667 0.45 3.51 1885 31 NaCT concentration (mM) 25 6.244998 OHM 33 6.557439


