Answered step by step
Verified Expert Solution
Link Copied!

Question

1 Approved Answer

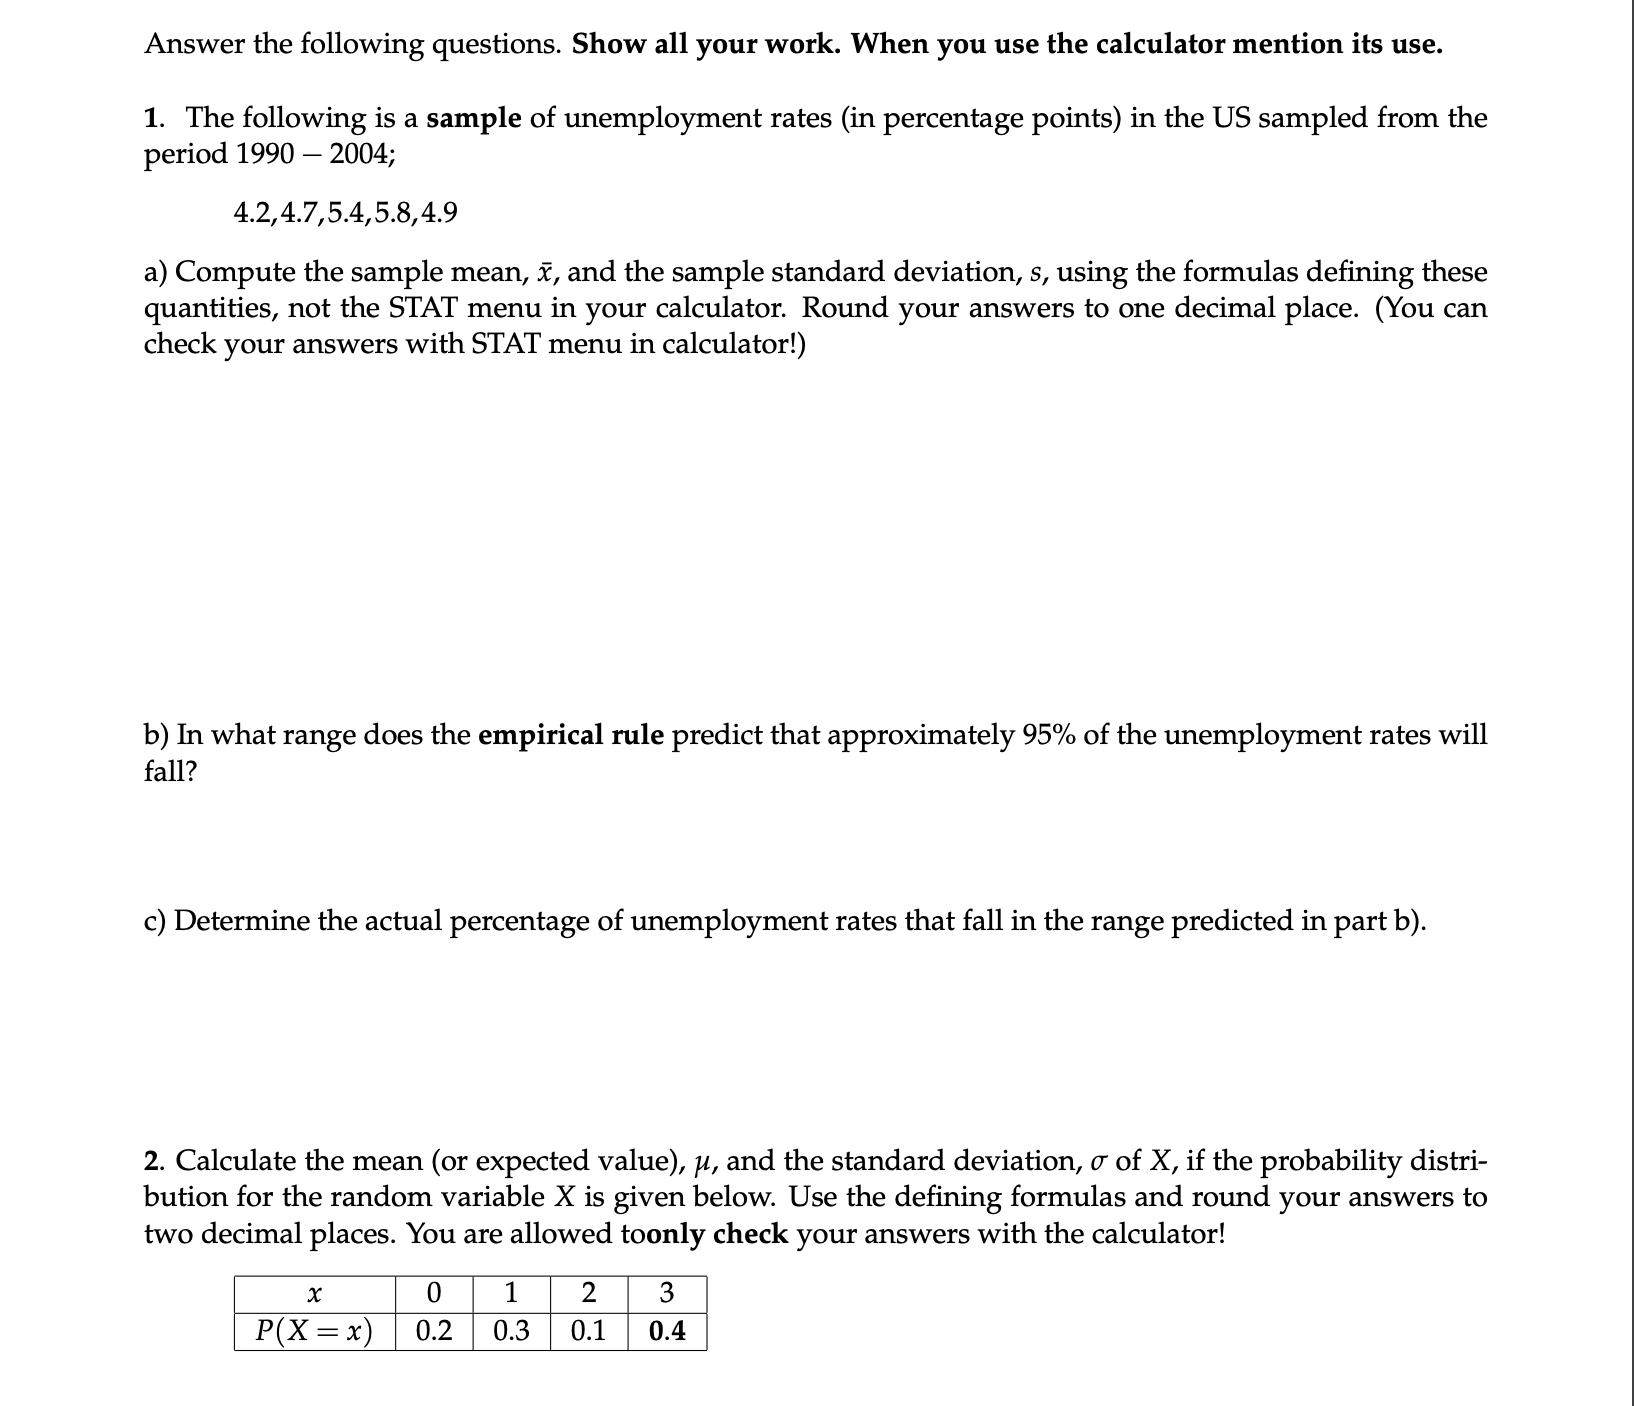
Thanks for the help Answer the following questions. Show all your work. When you use the calculator mention its use. 1. The following is a

Thanks for the help

image text in transcribed
Answer the following questions. Show all your work. When you use the calculator mention its use. 1. The following is a sample of unemployment rates (in percentage points) in the US sampled from the period 1990 2004; 4.2,4.7,5.4,5.8,4.9 a) Compute the sample mean, f, and the sample standard deviation, 3, using the formulas dening these quantities, not the STAT menu in your calculator. Round your answers to one decimal place. (You can check your answers with STAT menu in calculator!) b) In what range does the empirical rule predict that approximately 95% of the unemployment rates will fall? c) Determine the actual percentage of unemployment rates that fall in the range predicted in part b). 2. Calculate the mean (or expected value), 31, and the standard deviation, 0' of X, if the probability distri- bution for the random variable X is given below. Use the defining formulas and round your answers to two decimal places. You are allowed toonly check your answers with the calculator! x 0 1 2 3 P(X=x) 0.2 0.3 0.1 0.4

Step by Step Solution

There are 3 Steps involved in it

Step: 1

blur-text-image

Get Instant Access to Expert-Tailored Solutions

See step-by-step solutions with expert insights and AI powered tools for academic success

Step: 2

blur-text-image

Step: 3

blur-text-image

Ace Your Homework with AI

Get the answers you need in no time with our AI-driven, step-by-step assistance

Get Started

Recommended Textbook for

A First Course In Probability

Authors: Sheldon Ross

10th Edition

0134753119, 978-0134753119

More Books

Students also viewed these Mathematics questions

Question

=+a. (**) Calculate performance for each of the four years.

Answered: 1 week ago