

Answered step by step
Verified Expert Solution
Question
1 Approved Answer
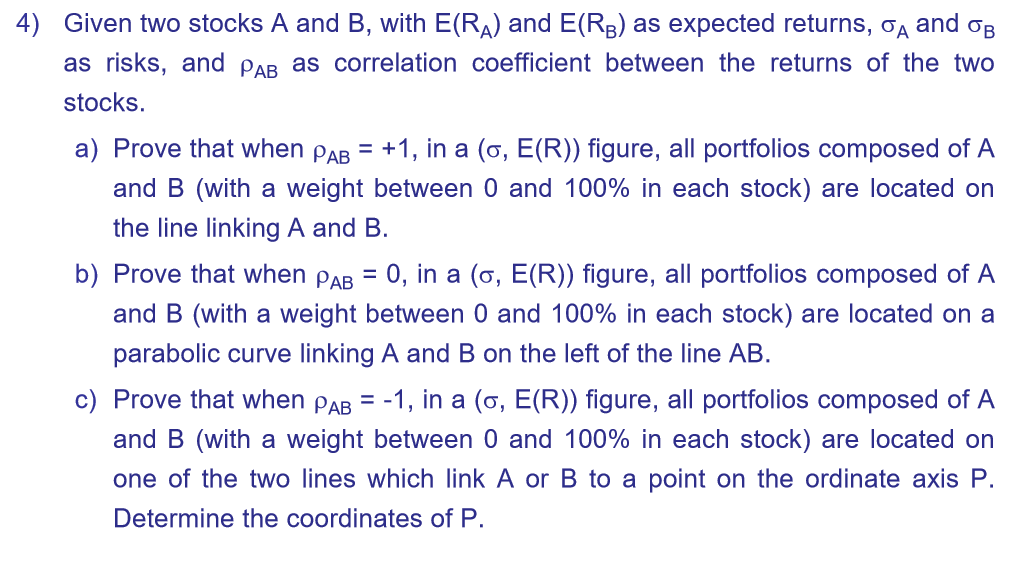
Thanks in advance, 4) Given two stocks A and B, with E(RA) and E(RB) as expected returns, and of as risks, and PAB as correlation
 Thanks in advance,
Step by Step Solution
There are 3 Steps involved in it
Step: 1

Get Instant Access to Expert-Tailored Solutions
See step-by-step solutions with expert insights and AI powered tools for academic success
Step: 2

Step: 3
Ace Your Homework with AI
Get the answers you need in no time with our AI-driven, step-by-step assistance
Get Started
International Financial Management
Authors: Jeff Madura
3rd Edition
0314862722, 978-0314862723