

A pediatric clinic is interested in reducing the rate of missed opportunities to vaccinate its patients...
Fantastic news! We've Found the answer you've been seeking!
Question:
![Logistic regression model estimates: - Coef. Std. Err. Z P>z! [95% Conf. Interval] t! .0040216 -.149222 .0712193 -.715349 .01](https://dsd5zvtm8ll6.cloudfront.net/si.experts.images/questions/2020/09/5f631350ae587_1600155696152.jpg)
Transcribed Image Text:
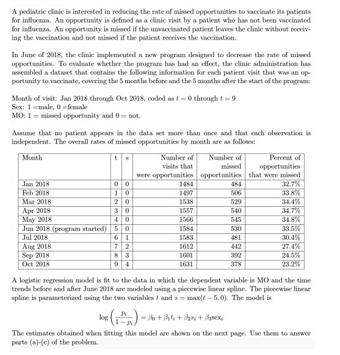
A pediatric clinic is interested in reducing the rate of missed opportunities to vaccinate its patients for info. An opportunity is defined as a clinic visit by a patient who has not been vaccinated for influenza. An opportunity is missed if the unvaccinated patient leaves the clinic without receiv ing the vaccination and not missed if the patient receives the vaccination. In June of 2018, the clinic implemented a new program designed to decrease the rate of mid opportunities. To evaluate whether the program has had an effect, the clinic administration has assembled a dates that contains the following information for each patient visit that was an op- portunity to vaccinate, covering the 5 months before and the 5 months after the start of the progra Mouth of visit: Jan 2018 through Oct 2018, coded as through t Sex: 1 male, female MO: 1-missed opportunity and not. Assume that no patient appears in the data set more than once and that each observation independent. The overall rates of missed opportunities by month are as follow Month Number of visits that Number of missed Percent of opportunities were opportunities opportunities that were missed Jan 2018 00 1454 484 32.7% Feb 2018 10 1857 506 33.8% Mar 2018 20 1538 529 34.4% Apr 2018 30 1557 540 34.7% May 2018 40 1566 545 34.8% Jun 2018 (program started) 50 1584 530 33.5% Jul 2018 61 1583 481 30.4% Aug 2018 72 1612 442 27.4% Sep 2018 83 1001 392 24.5% Oct 2018 1631 378 23.26 A logistic regression model is fit to the data in which the dependent variable is MO and the time trends before and after June 2018 are modeled using a piecewise linear spline. The piecewise line spline is parameterized using the two variables and max(-5,0). The model is ()- +++ The estimates obtained when fitting this model are shown on the next page. Use them to answer parts (a)-(c) of the problem Logistic regression model estimates: | Coef. Std. Err. Z P>|z| [95% Conf. Interval] tl .0040216 .0117921 s | -.149222 .0243438 0.34 -6.13 0.000 0.733 -.0190905 .0271337 -.196935 -.101509 sex | intercept | .0712193 -.715349 .0347585 2.05 0.040 .0030939 .1393447 .0425485 -16.81 0.000 -.7987425 -.6319555 (a) Provide the odds ratio for sex, along with a brief interpretation. (b) According to the model results, what is the probability that a visit by a male patient in March 2018 was a missed opportunity? (c) Is there evidence from the logistic modeling results that the probability of a missed oppor- tunity decreased after the program was implemented? Support your answer with a careful interpretation of the coefficients of t and s and their signs and significance. Explain how you could formally test whether the rate of missed opportunities has been decreasing over the period from June 2018 to October 2018. (d) Now suppose that instead of using t and s as continous predictors, a model is fit treating t as a categorical variable. The corresponding dummy variables will be constructed so that t=0 is the reference category and d; = 1 if t = j and d; = 0 otherwise, for j = 1,2...,9. The corresponding model is Pi log ... + Badg,i+ B10sexi Bo+Bidi,i+4 Explain how to test whether the average log odds of a missed opportunity for months February through May 2018 (t = 1 to 4) is equal to the average log odds of a missed opportunity for the months July through October 2018 (t = 6 to 9), using this model and a linear contrast. Explain what a significant test would tell you about the success of the program and how this differs conceptually from part (c). A pediatric clinic is interested in reducing the rate of missed opportunities to vaccinate its patients for info. An opportunity is defined as a clinic visit by a patient who has not been vaccinated for influenza. An opportunity is missed if the unvaccinated patient leaves the clinic without receiv ing the vaccination and not missed if the patient receives the vaccination. In June of 2018, the clinic implemented a new program designed to decrease the rate of mid opportunities. To evaluate whether the program has had an effect, the clinic administration has assembled a dates that contains the following information for each patient visit that was an op- portunity to vaccinate, covering the 5 months before and the 5 months after the start of the progra Mouth of visit: Jan 2018 through Oct 2018, coded as through t Sex: 1 male, female MO: 1-missed opportunity and not. Assume that no patient appears in the data set more than once and that each observation independent. The overall rates of missed opportunities by month are as follow Month Number of visits that Number of missed Percent of opportunities were opportunities opportunities that were missed Jan 2018 00 1454 484 32.7% Feb 2018 10 1857 506 33.8% Mar 2018 20 1538 529 34.4% Apr 2018 30 1557 540 34.7% May 2018 40 1566 545 34.8% Jun 2018 (program started) 50 1584 530 33.5% Jul 2018 61 1583 481 30.4% Aug 2018 72 1612 442 27.4% Sep 2018 83 1001 392 24.5% Oct 2018 1631 378 23.26 A logistic regression model is fit to the data in which the dependent variable is MO and the time trends before and after June 2018 are modeled using a piecewise linear spline. The piecewise line spline is parameterized using the two variables and max(-5,0). The model is ()- +++ The estimates obtained when fitting this model are shown on the next page. Use them to answer parts (a)-(c) of the problem Logistic regression model estimates: | Coef. Std. Err. Z P>|z| [95% Conf. Interval] tl .0040216 .0117921 s | -.149222 .0243438 0.34 -6.13 0.000 0.733 -.0190905 .0271337 -.196935 -.101509 sex | intercept | .0712193 -.715349 .0347585 2.05 0.040 .0030939 .1393447 .0425485 -16.81 0.000 -.7987425 -.6319555 (a) Provide the odds ratio for sex, along with a brief interpretation. (b) According to the model results, what is the probability that a visit by a male patient in March 2018 was a missed opportunity? (c) Is there evidence from the logistic modeling results that the probability of a missed oppor- tunity decreased after the program was implemented? Support your answer with a careful interpretation of the coefficients of t and s and their signs and significance. Explain how you could formally test whether the rate of missed opportunities has been decreasing over the period from June 2018 to October 2018. (d) Now suppose that instead of using t and s as continous predictors, a model is fit treating t as a categorical variable. The corresponding dummy variables will be constructed so that t=0 is the reference category and d; = 1 if t = j and d; = 0 otherwise, for j = 1,2...,9. The corresponding model is Pi log ... + Badg,i+ B10sexi Bo+Bidi,i+4 Explain how to test whether the average log odds of a missed opportunity for months February through May 2018 (t = 1 to 4) is equal to the average log odds of a missed opportunity for the months July through October 2018 (t = 6 to 9), using this model and a linear contrast. Explain what a significant test would tell you about the success of the program and how this differs conceptually from part (c). A pediatric clinic is interested in reducing the rate of missed opportunities to vaccinate its patients for info. An opportunity is defined as a clinic visit by a patient who has not been vaccinated for influenza. An opportunity is missed if the unvaccinated patient leaves the clinic without receiv ing the vaccination and not missed if the patient receives the vaccination. In June of 2018, the clinic implemented a new program designed to decrease the rate of mid opportunities. To evaluate whether the program has had an effect, the clinic administration has assembled a dates that contains the following information for each patient visit that was an op- portunity to vaccinate, covering the 5 months before and the 5 months after the start of the progra Mouth of visit: Jan 2018 through Oct 2018, coded as through t Sex: 1 male, female MO: 1-missed opportunity and not. Assume that no patient appears in the data set more than once and that each observation independent. The overall rates of missed opportunities by month are as follow Month Number of visits that Number of missed Percent of opportunities were opportunities opportunities that were missed Jan 2018 00 1454 484 32.7% Feb 2018 10 1857 506 33.8% Mar 2018 20 1538 529 34.4% Apr 2018 30 1557 540 34.7% May 2018 40 1566 545 34.8% Jun 2018 (program started) 50 1584 530 33.5% Jul 2018 61 1583 481 30.4% Aug 2018 72 1612 442 27.4% Sep 2018 83 1001 392 24.5% Oct 2018 1631 378 23.26 A logistic regression model is fit to the data in which the dependent variable is MO and the time trends before and after June 2018 are modeled using a piecewise linear spline. The piecewise line spline is parameterized using the two variables and max(-5,0). The model is ()- +++ The estimates obtained when fitting this model are shown on the next page. Use them to answer parts (a)-(c) of the problem Logistic regression model estimates: | Coef. Std. Err. Z P>|z| [95% Conf. Interval] tl .0040216 .0117921 s | -.149222 .0243438 0.34 -6.13 0.000 0.733 -.0190905 .0271337 -.196935 -.101509 sex | intercept | .0712193 -.715349 .0347585 2.05 0.040 .0030939 .1393447 .0425485 -16.81 0.000 -.7987425 -.6319555 (a) Provide the odds ratio for sex, along with a brief interpretation. (b) According to the model results, what is the probability that a visit by a male patient in March 2018 was a missed opportunity? (c) Is there evidence from the logistic modeling results that the probability of a missed oppor- tunity decreased after the program was implemented? Support your answer with a careful interpretation of the coefficients of t and s and their signs and significance. Explain how you could formally test whether the rate of missed opportunities has been decreasing over the period from June 2018 to October 2018. (d) Now suppose that instead of using t and s as continous predictors, a model is fit treating t as a categorical variable. The corresponding dummy variables will be constructed so that t=0 is the reference category and d; = 1 if t = j and d; = 0 otherwise, for j = 1,2...,9. The corresponding model is Pi log ... + Badg,i+ B10sexi Bo+Bidi,i+4 Explain how to test whether the average log odds of a missed opportunity for months February through May 2018 (t = 1 to 4) is equal to the average log odds of a missed opportunity for the months July through October 2018 (t = 6 to 9), using this model and a linear contrast. Explain what a significant test would tell you about the success of the program and how this differs conceptually from part (c). A pediatric clinic is interested in reducing the rate of missed opportunities to vaccinate its patients for info. An opportunity is defined as a clinic visit by a patient who has not been vaccinated for influenza. An opportunity is missed if the unvaccinated patient leaves the clinic without receiv ing the vaccination and not missed if the patient receives the vaccination. In June of 2018, the clinic implemented a new program designed to decrease the rate of mid opportunities. To evaluate whether the program has had an effect, the clinic administration has assembled a dates that contains the following information for each patient visit that was an op- portunity to vaccinate, covering the 5 months before and the 5 months after the start of the progra Mouth of visit: Jan 2018 through Oct 2018, coded as through t Sex: 1 male, female MO: 1-missed opportunity and not. Assume that no patient appears in the data set more than once and that each observation independent. The overall rates of missed opportunities by month are as follow Month Number of visits that Number of missed Percent of opportunities were opportunities opportunities that were missed Jan 2018 00 1454 484 32.7% Feb 2018 10 1857 506 33.8% Mar 2018 20 1538 529 34.4% Apr 2018 30 1557 540 34.7% May 2018 40 1566 545 34.8% Jun 2018 (program started) 50 1584 530 33.5% Jul 2018 61 1583 481 30.4% Aug 2018 72 1612 442 27.4% Sep 2018 83 1001 392 24.5% Oct 2018 1631 378 23.26 A logistic regression model is fit to the data in which the dependent variable is MO and the time trends before and after June 2018 are modeled using a piecewise linear spline. The piecewise line spline is parameterized using the two variables and max(-5,0). The model is ()- +++ The estimates obtained when fitting this model are shown on the next page. Use them to answer parts (a)-(c) of the problem Logistic regression model estimates: | Coef. Std. Err. Z P>|z| [95% Conf. Interval] tl .0040216 .0117921 s | -.149222 .0243438 0.34 -6.13 0.000 0.733 -.0190905 .0271337 -.196935 -.101509 sex | intercept | .0712193 -.715349 .0347585 2.05 0.040 .0030939 .1393447 .0425485 -16.81 0.000 -.7987425 -.6319555 (a) Provide the odds ratio for sex, along with a brief interpretation. (b) According to the model results, what is the probability that a visit by a male patient in March 2018 was a missed opportunity? (c) Is there evidence from the logistic modeling results that the probability of a missed oppor- tunity decreased after the program was implemented? Support your answer with a careful interpretation of the coefficients of t and s and their signs and significance. Explain how you could formally test whether the rate of missed opportunities has been decreasing over the period from June 2018 to October 2018. (d) Now suppose that instead of using t and s as continous predictors, a model is fit treating t as a categorical variable. The corresponding dummy variables will be constructed so that t=0 is the reference category and d; = 1 if t = j and d; = 0 otherwise, for j = 1,2...,9. The corresponding model is Pi log ... + Badg,i+ B10sexi Bo+Bidi,i+4 Explain how to test whether the average log odds of a missed opportunity for months February through May 2018 (t = 1 to 4) is equal to the average log odds of a missed opportunity for the months July through October 2018 (t = 6 to 9), using this model and a linear contrast. Explain what a significant test would tell you about the success of the program and how this differs conceptually from part (c).
Expert Answer:
Answer rating: 100% (QA)
According to the information provided in the image the company is interested in analyzing the rate of missed opportunities to improve efficiency The d... View the full answer

Related Book For 

Posted Date:
Students also viewed these mathematics questions
-
A major automobile company is interested in reducing the time that customers have to wait while having their car serviced with one of the dealers. They select four customers randomly each day and...
-
A major automobile company is interested in reducing the time that customers have to wait while having their car serviced with one of the dealers. They select four customers randomly each day and...
-
A manufacturer of magnetic tapes is interested in reducing the variability of the thickness of the coating on the tape. It is estimated that the loss to the consumer is $10 per reel if the thickness...
-
At one time the Thames River in England supported an abundant community of fish. Pollution then destroyed all the fish in a 40-mile stretch near its mouth for a 45-year period beginning in 1915....
-
Name four approaches a company can take to increase retention of technical staff.
-
The table shows the number of goals allowed and the total points earned (2 points for a win and 1 point for an overtime or shootout loss) by the 14 Western Conference teams in the 20162017 National...
-
Earlier we saw that a single transistor in a computer chip 0.000000014 meters, or \(1.4 \times 10^{-8} \mathrm{~m}\), in size, and that the diameter of an atom could be 0.2 nanometers, or \(2 \times...
-
Jims Outfitters, Inc., makes custom fancy shirts for cowboys. The shirts could be flawed in various ways, including flaws in the weave or color of the fabric, loose buttons or decorations, wrong...
-
Good morning to you! Please could you do this for me to show how it should be done? Thank you so very much in advance!. 1. Using the Bank Statement below for the month of October and the columns of...
-
A. Compute the mean return and variance of return for each stock in Problem 1 using (1) The single-index model (2) The historical data In Problem 1 B. Compute the covariance between each possible...
-
What mechanism predominates in the reaction below? CH;CH, NaOCH;, CH;OH Select one: SN1 with rearrangement SN1 without rearrangement SN2 O E2 E1
-
2. (25 points) A high altitude science balloon (called a NASA pumpkin balloon) is filled with gas on the ground then inflates to the shape shown as it ascends. It is made of a thin plastic membrane...
-
Michael, I came across a different aspect of advertisement. Very lame but worked well. Context: You are a global car maker marketing your new electric car model. Imagine this: you give the ad agency...
-
PROBLEM A race car accelerates uniformly from a speed of 40.0 m/s to a speed of 60.0 m/s in 5.00 s while traveling counterclockwise around a circular track of radius 4.00 102 m. When the car reaches...
-
Calculate the forces on q1, q2 and q4. q4= 4C 0 = 60 q1 = | Mc R1 = 1.5m q2 = R2 = 24 2uc 1.0m 3 + R 94 R 92 +-x
-
The Rolling Department of Jabari Steel Company had 7,407 tons in beginning work in process inventory (90% complete) on October 1. During October, 82,300 tons were completed. The ending work in...
-
You are Robert James, a professional accountant working in Windsor Ontario. After many years as a full time Public Accountant first with the local office of a large international firm, and then in...
-
Three successive resonance frequencies in an organ pipe are 1310, 1834, and 2358 Hz. (a) Is the pipe closed at one end or open at both ends? (b) What is the fundamental frequency? (c) What is the...
-
Here is the stress level (scored 1-10, with higher scores = higher stress) for college freshmen during the first week of classes, middle week of classes, and last week of classes: a. Create three...
-
"Everyone knows" that certain college majors are associated with larger salaries for graduates. Is that really so? Here are the annual salaries (in thousands of dollars) for 8 randomly selected...
-
Examine the following ANOVA summary table: b. Assuming equal numbers of subjects per group, how many subjects were in each group? c. What is the tabled critical value of F at the .01 level? d. What...
-
Go to the Internet and listen to the 1976 country-western song by Johnny Cash, "One Piece at a Time." What is the moral of this song?
-
Fraud Bingo Be a Sleuth: Use your answer to "catch" one of the first and most famous fraudsters: A T Ohio Congressman who has 2002 act named after him that responded to Enron crisis CED in big fraud...
-
1.3 Eurocurrencies and Eurocurrency Markets. What are the major eurocurrencies? What is meant by a Eurocurrency market?

Study smarter with the SolutionInn App