The table shows the number of goals allowed and the total points earned (2 points for a
Question:
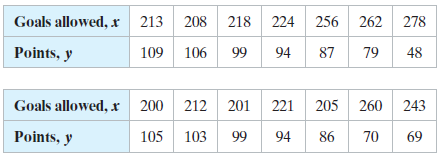
The table shows the number of goals allowed and the total points earned (2 points for a win and 1 point for an overtime or shootout loss) by the 14 Western Conference teams in the 2016–2017 National Hockey League season. The equation of the regression line is ŷ = -0.573x + 220.087.

Use the data to
(a) Find the coefficient of determination r2 and interpret the result, and
(b) Find the standard error of estimate se and interpret the result.
Fantastic news! We've Found the answer you've been seeking!
Step by Step Answer:
Related Book For 

Elementary Statistics Picturing The World
ISBN: 9780134683416
7th Edition
Authors: Ron Larson, Betsy Farber
Question Posted:


