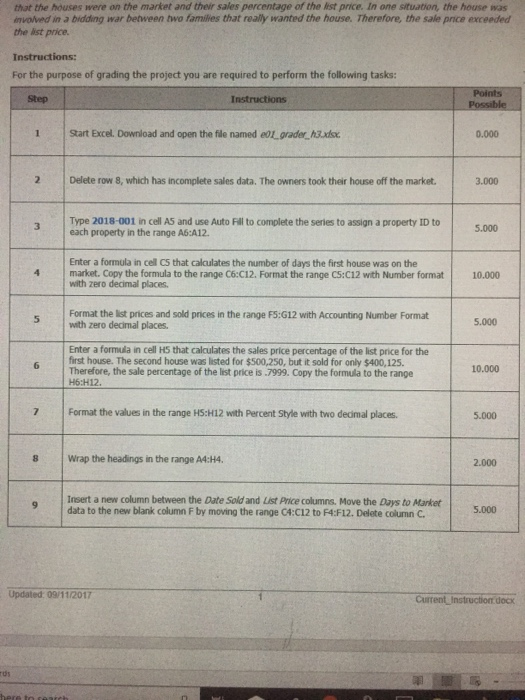
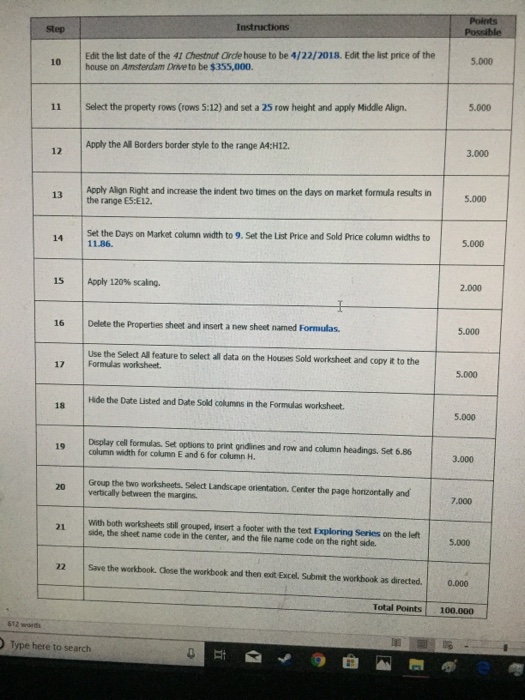
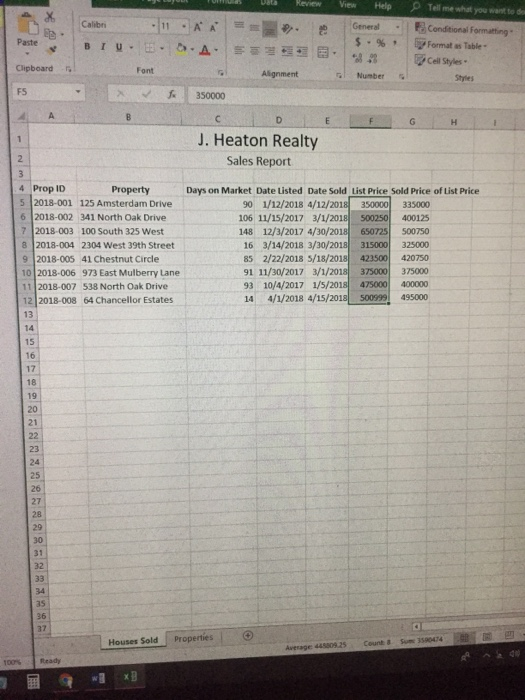
that the houses were on the market and their sales percentage of the lst price. In one situation, the house was involved in a bidding war bebween two families that really wanted the house. Therefore, the sale price exceeded the ist price. Instructions: For the purpose of grading the project you are required to perform the following tasks: Step 1 Start Excel. Download and open the file named eo1 grader h3.xdsx 0.000 2 Delete row 8, which has incomplete sales data. The owners took their house off the market 3.000 Type 2018-001 in cell AS and use Auto Fill to complete the series to assign a property ID to 5.000 each property in the range A5:A12. Enter a formula in cell CS that calculates the number of days the first house was on the with zero decimal places Format the list prices and sold prices in the range F5:G12 with Accounting Number Format Enter a formula in cell H5 that calculates the sales price percentage of the list price for the 4 market. Copy the formula to the range C6:C12. Format the range CS:C12 with Number format 10.000 with zero decimal places 5.000 first house. The second house was listed for $500,250, but it sold for only $400,125. 6 10.000 Therefore, the sale percentage of the list price is .7999. Copy the formula to the range H6:H12. 7 Format the values in the range HS:H12 with Percent Style with two decimal places. 5.000 8 Wrap the headings in the range A4:H4. 2.000 Insert a new column between the Date Sold and List Price columns. Move the Days to Market data to the new blank column F by moving the range C4:C12 to F4:F12. Delete column C 5.000 Updated 09/11/2017 Current Instruction docx Edit the list date of the 41 Chestnut Oirdle house to be 4/22/2018. Edit the list price of the house on Amsterdam Drive to be $355,000. 5.000 5.000 11 Select the property rows (rows 5:12) and set a 25 row height and apply Middle Align Apply the All Borders border style to the range A4:H12. 3.000 12 13 Aoply Align Right and increase the indent two times on the days on market formula results in 1the range ES:E12. 5.000 4 Set the Days on Market column wdth to 9. Set the List Price and Sold Price column widths to 5.000 15 | Apply 120% saing. 2.000 16 Delete the Properties sheet and insert a new sheet named Formulas. 5.000 Use the Select Allfeature to select all data on the Houses Sold worksheet and copy it to the 17 Formulas worksheet. 5.000 Hide the Date Listed and Date Sold columns in the Formulas worksheet. Display cell formulas. Set options to print gridlines and row and column headings. Set 6.86 Group the two worksheets. Select Landscape orientation. Center the page hortzontally and With both worksheets still grouped, insert a footer with the text Exploring Series on the left 5.000 19 column width for column E and 6 for column H. 3.000 2vertically between the margins. 7.000 21 side, the sheet name code in the center, and the file narne code on the right side. 22 Save the workbook. Close the workbook and then edt Excel Submit the workbook as directed Total Points 100.000 612 ward ) Type here to search ll Review View Help Telmwhat you want to de ,General Paste $-% , Format as Table Cell Styles. Clipboard Font Alignment Number FS 350000 J. Heaton Realty Sales Report 4 Prop ID Property Days on Market Date Listed Date Sold List Price Sold Price of List Price 2018-001 125 Amsterdam Drive 6 2018-002 341 North Oak Drive 90 1/12/2018 4/12/2018 350000 335000 106 11/15/2017 3/1/2018 500250 400125 148 12/3/2017 4/30/2018 650725 500750 16 3/14/2018 3/30/2018 315000 325000 85 2/22/2018 5/18/2018 423500 91 11/30/2017 3/1/2018 375000 375000 93 10/4/2017 1/5/2018 000 400000 14 4/1/2018 4/15/2018 500999 49500 2018-003 100 South 325 West 8 2018-004 2304 West 39th Street 9 2018-005 41 Chestnut Circle 10 2018-006 973 East Mulberry Lane 2018-007 538 North Oak Drive 12 2018-008 64 Chancellor Estates 13 14 15 16 17 18 19 21 23 24 25 26 27 28 32 as 36 37 Houses Sold Properties|O Average: 445809 25 Count& Sum 3590474 100% Ready