Answered step by step
Verified Expert Solution
Question
1 Approved Answer
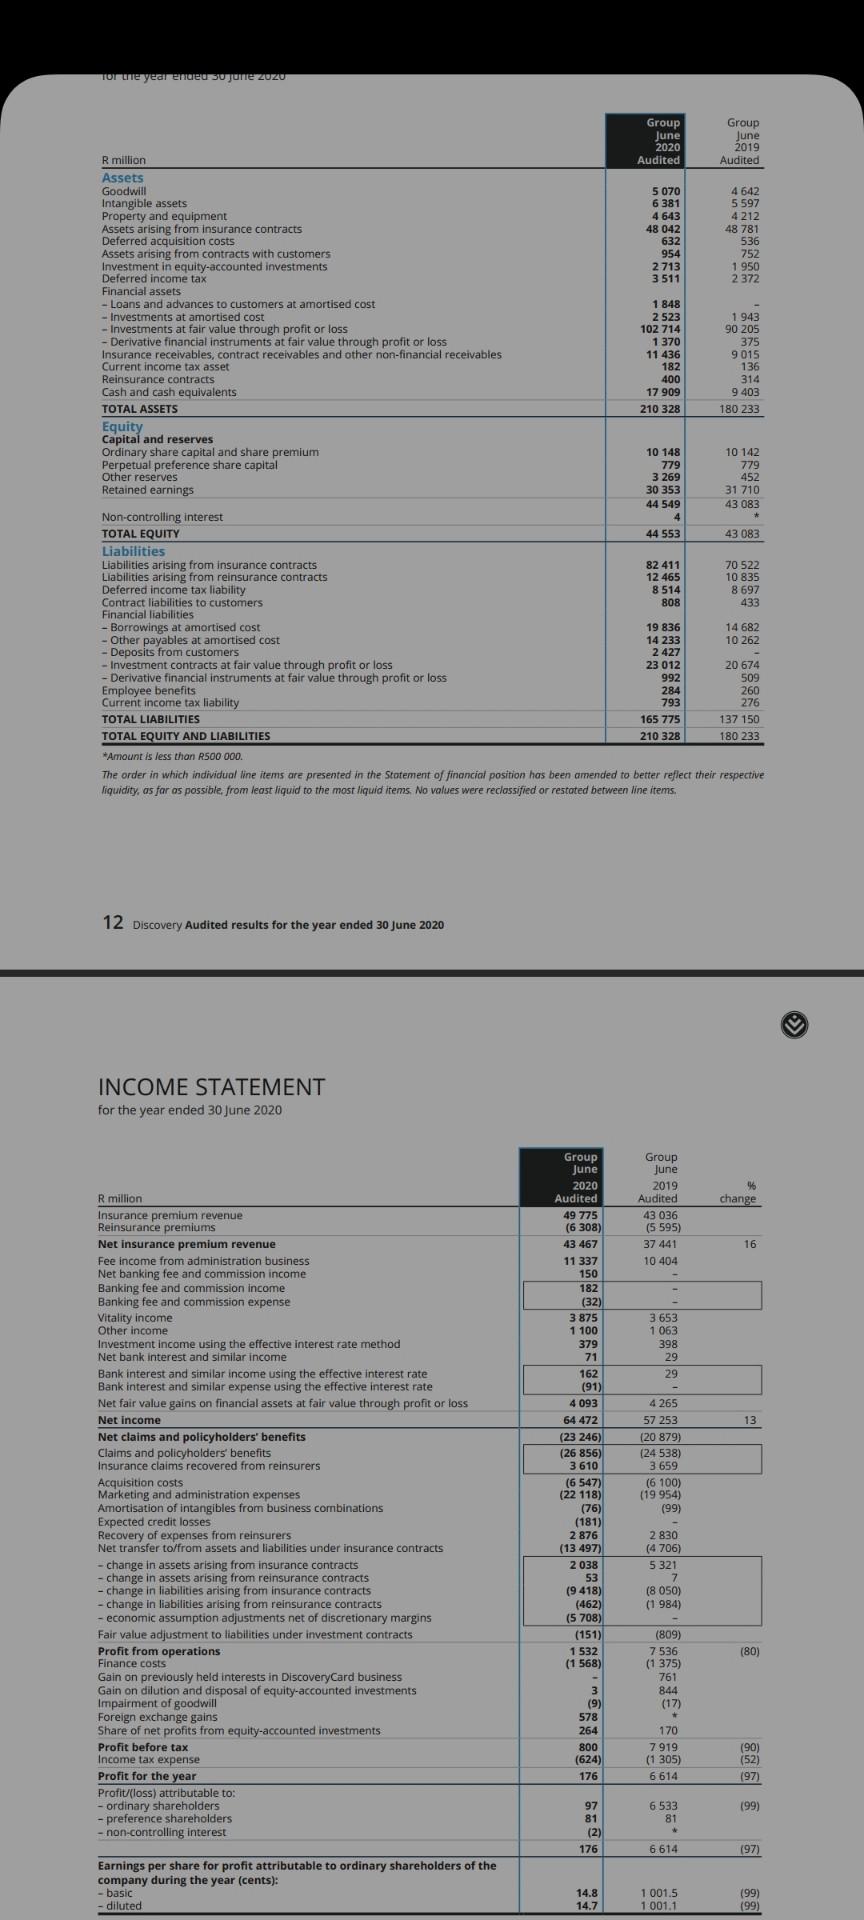
the 1st graph is for statement of financial position... can I use this graphs to find this questions?? ( using financial statement ratio to determine

the 1st graph is for statement of financial position... can I use this graphs to find this questions??
( using financial statement ratio to determine the possible effect of the COVID 19 Pandemic on its performance) you can use multiple ratios for each element.. 1. profitability 2.efficiency 3.liquidity 4.investment 5. financial gearing.
I am told to download annual report and calculate those questions. is it possible or not?
for the year ended so june zozo Group Group June June 2020 2019 R million Audited Audited Assets Goodwill 5 070 6381 Intangible assets 4642 5 597 4212 Property and equipment 4 643 48 781 Assets arising from insurance contracts Deferred acquisition costs 48 042 632 536 Assets arising from contracts with customers 954 752 2713 1950 Investment in equity-accounted investments Deferred income tax 3511 2372 Financial assets - Loans and advances to customers at amortised cost 1 848 - Investments at amortised cost 2 523 1943 - Investments at fair value through profit or loss 102 714 90 205 - Derivative financial instruments at fair value through profit or loss Insurance receivables, contract receivables and other non-financial receivables Current income tax asset 1.370 11 436 375 9015 136 182 400 Reinsurance contracts 314 Cash and cash equivalents 17 909 9 403 TOTAL ASSETS 210 328 180 233 Equity Capital and reserves 10 142 Ordinary share capital and share premium Perpetual preference share capital 779 10 148 779 3 269 30 353 Other reserves 452 Retained earnings 31 710 44 549 43 083 Non-controlling interest TOTAL EQUITY 44 553 43 083 Liabilities Liabilities arising from insurance contracts 82 411 70 522 Liabilities arising from reinsurance contracts 12 465 10 835 Deferred income tax liability 8514 808 8 697 433 Contract liabilities to customers Financial liabilities Borrowings at amortised cost 19 836 14 682 - Other payables at amortised cost 14 233 10 262 - Deposits from customers 2 427 - Investment contracts at fair value through profit or loss 23 012 20 674 992 509 - Derivative financial instruments at fair value through profit or loss Employee benefits. 284 260 Current income tax liability 793 276 TOTAL LIABILITIES 165 775 137 150 TOTAL EQUITY AND LIABILITIES 210 328 180 233 *Amount is less than R500 000. The order in which individual line items are presented in the Statement of financial position has been amended to better reflect their respective liquidity, as far as possible, from least liquid to the most liquid items. No values were reclassified or restated between line items. 12 Discovery Audited results for the year ended 30 June 2020 INCOME STATEMENT for the year ended 30 June 2020 R million Insurance premium revenue Reinsurance premiums Net insurance premium revenue Fee income from administration business Net banking fee and commission income Banking fee and commission income Banking fee and commission expense Vitality income Other income Investment income using the effective interest rate method Net bank interest and similar income Bank interest and similar income using the effective interest rate Bank interest and similar expense using the effective interest rate Net fair value gains on financial assets at fair value through profit or loss Net income Net claims and policyholders' benefits Claims and policyholders' benefits Insurance claims recovered from reinsurers Acquisition costs Marketing and administration expenses Amortisation of intangibles from business combinations Expected credit losses Recovery of expenses from reinsurers Net transfer to/from assets and liabilities under insurance contracts - change in assets arising from insurance contracts - change in assets arising from reinsurance contracts - change in liabilities arising from insurance contracts - change in liabilities arising from reinsurance contracts - economic assumption adjustments net of discretionary margins Fair value adjustment to liabilities under investment contracts Profit from operations Finance costs Gain on previously held interests in DiscoveryCard business Gain on dilution and disposal of equity-accounted investments Impairment of goodwill Foreign exchange gains Share of net profits from equity-accounted investments Profit before tax Income tax expense Profit for the year Profit/(loss) attributable to: - ordinary shareholders - preference shareholders - non-controlling interest Earnings per share for profit attributable to ordinary shareholders of the company during the year (cents): - basic -diluted. Group June 2020 Audited 49 775 (6 308) 43 467 11 337 150 182 (32) 3 875 1 100 379 71 162 (91) 4 093 64 472 (23 246) (26 856) 3610 (6 547) (22 118) (76) (181) 2 876 (13 497) 2 038 53 (9 418) (462) (5 708) (151) 1532 (1 568) 3 (9) 578 264 800 (624) 176 97 81 (2) 176 14.8 14.7 Group June 2019 Audited 43 036 (5 595) 37 441 10 404 3 653 1 063 398 29 29 - 4 265 57 253 (20 879) (24 538) 3.659 (6 100) (19 954) (99) 2 830 (4 706) 5 321 7 (8 050) (1984) (809) 7536 (1 375) 761 844 (17) * 170 7919 (1 305) 6614 6.533 81 * 6614 1 001.5 1:001.1 % change 16 13 (80) (90) (52) (97) (99) (97) (99) (99) for the year ended so june zozo Group Group June June 2020 2019 R million Audited Audited Assets Goodwill 5 070 6381 Intangible assets 4642 5 597 4212 Property and equipment 4 643 48 781 Assets arising from insurance contracts Deferred acquisition costs 48 042 632 536 Assets arising from contracts with customers 954 752 2713 1950 Investment in equity-accounted investments Deferred income tax 3511 2372 Financial assets - Loans and advances to customers at amortised cost 1 848 - Investments at amortised cost 2 523 1943 - Investments at fair value through profit or loss 102 714 90 205 - Derivative financial instruments at fair value through profit or loss Insurance receivables, contract receivables and other non-financial receivables Current income tax asset 1.370 11 436 375 9015 136 182 400 Reinsurance contracts 314 Cash and cash equivalents 17 909 9 403 TOTAL ASSETS 210 328 180 233 Equity Capital and reserves 10 142 Ordinary share capital and share premium Perpetual preference share capital 779 10 148 779 3 269 30 353 Other reserves 452 Retained earnings 31 710 44 549 43 083 Non-controlling interest TOTAL EQUITY 44 553 43 083 Liabilities Liabilities arising from insurance contracts 82 411 70 522 Liabilities arising from reinsurance contracts 12 465 10 835 Deferred income tax liability 8514 808 8 697 433 Contract liabilities to customers Financial liabilities Borrowings at amortised cost 19 836 14 682 - Other payables at amortised cost 14 233 10 262 - Deposits from customers 2 427 - Investment contracts at fair value through profit or loss 23 012 20 674 992 509 - Derivative financial instruments at fair value through profit or loss Employee benefits. 284 260 Current income tax liability 793 276 TOTAL LIABILITIES 165 775 137 150 TOTAL EQUITY AND LIABILITIES 210 328 180 233 *Amount is less than R500 000. The order in which individual line items are presented in the Statement of financial position has been amended to better reflect their respective liquidity, as far as possible, from least liquid to the most liquid items. No values were reclassified or restated between line items. 12 Discovery Audited results for the year ended 30 June 2020 INCOME STATEMENT for the year ended 30 June 2020 R million Insurance premium revenue Reinsurance premiums Net insurance premium revenue Fee income from administration business Net banking fee and commission income Banking fee and commission income Banking fee and commission expense Vitality income Other income Investment income using the effective interest rate method Net bank interest and similar income Bank interest and similar income using the effective interest rate Bank interest and similar expense using the effective interest rate Net fair value gains on financial assets at fair value through profit or loss Net income Net claims and policyholders' benefits Claims and policyholders' benefits Insurance claims recovered from reinsurers Acquisition costs Marketing and administration expenses Amortisation of intangibles from business combinations Expected credit losses Recovery of expenses from reinsurers Net transfer to/from assets and liabilities under insurance contracts - change in assets arising from insurance contracts - change in assets arising from reinsurance contracts - change in liabilities arising from insurance contracts - change in liabilities arising from reinsurance contracts - economic assumption adjustments net of discretionary margins Fair value adjustment to liabilities under investment contracts Profit from operations Finance costs Gain on previously held interests in DiscoveryCard business Gain on dilution and disposal of equity-accounted investments Impairment of goodwill Foreign exchange gains Share of net profits from equity-accounted investments Profit before tax Income tax expense Profit for the year Profit/(loss) attributable to: - ordinary shareholders - preference shareholders - non-controlling interest Earnings per share for profit attributable to ordinary shareholders of the company during the year (cents): - basic -diluted. Group June 2020 Audited 49 775 (6 308) 43 467 11 337 150 182 (32) 3 875 1 100 379 71 162 (91) 4 093 64 472 (23 246) (26 856) 3610 (6 547) (22 118) (76) (181) 2 876 (13 497) 2 038 53 (9 418) (462) (5 708) (151) 1532 (1 568) 3 (9) 578 264 800 (624) 176 97 81 (2) 176 14.8 14.7 Group June 2019 Audited 43 036 (5 595) 37 441 10 404 3 653 1 063 398 29 29 - 4 265 57 253 (20 879) (24 538) 3.659 (6 100) (19 954) (99) 2 830 (4 706) 5 321 7 (8 050) (1984) (809) 7536 (1 375) 761 844 (17) * 170 7919 (1 305) 6614 6.533 81 * 6614 1 001.5 1:001.1 % change 16 13 (80) (90) (52) (97) (99) (97) (99) (99)Step by Step Solution
There are 3 Steps involved in it
Step: 1

Get Instant Access to Expert-Tailored Solutions
See step-by-step solutions with expert insights and AI powered tools for academic success
Step: 2

Step: 3

Ace Your Homework with AI
Get the answers you need in no time with our AI-driven, step-by-step assistance
Get Started


