Question
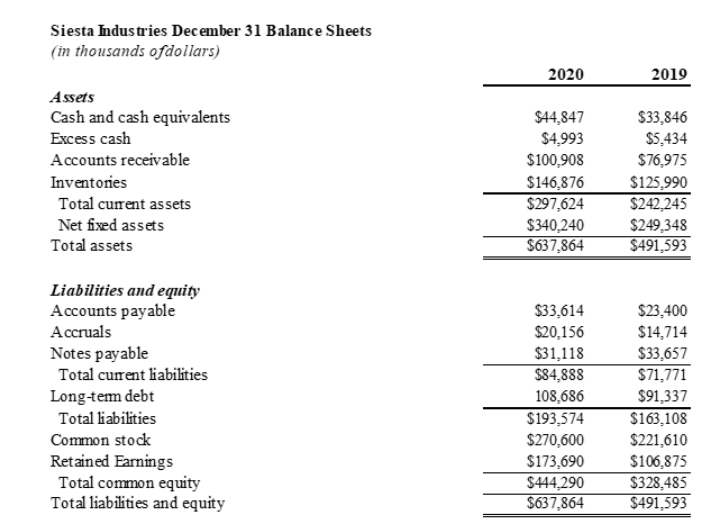
The 2020 and 2019 balance sheets for Siesta Industries are provided below. The companys sales for 2020 were $1,100 million, and EBITDA was 20% of
The 2020 and 2019 balance sheets for Siesta Industries are provided below. The companys sales for 2020 were $1,100 million, and EBITDA was 20% of sales. Furthermore, depreciation amounted to 10% of net fixed assets, interest expense was $24 million, the corporate tax rate was 25%, and Siesta pays out 45% of its net income as dividends. Siesta had 10 million shares outstanding in 2020, the 12/31/20 stock price was $75 per share, and its after-tax cost of capital was 12%.
***Need help setting up the companys 2020 Statement of Stockholders Equity in EXCEL

Siesta Industries December 31 Balance Sheets (in thousands ofdollars) 2020 2019 Assets Cash and cash equivalents Excess cash Accounts receivable Inventories Total current assets Net fixed assets Total assets $44,847 $4.993 $100,908 $146,876 $297,624 $340,240 $637,864 $33,846 $5,434 $76,975 $125,990 $242,245 $249,348 $491,593 Liabilities and equity Accounts payable Accruals Notes payable Total current liabilities Long-term debt Total liabilities Common stock Retained Earnings Total common equity Total liabilities and equity $33,614 $20,156 $31,118 $84,888 108,686 $193,574 $270,600 $173,690 $444,290 $637,864 $23,400 $14,714 $33,657 $71,771 $91,337 $163,108 $221,610 $106,875 $328,485 $491,593
Step by Step Solution
There are 3 Steps involved in it
Step: 1

Get Instant Access to Expert-Tailored Solutions
See step-by-step solutions with expert insights and AI powered tools for academic success
Step: 2

Step: 3

Ace Your Homework with AI
Get the answers you need in no time with our AI-driven, step-by-step assistance
Get Started


