

Answered step by step
Verified Expert Solution
Question
1 Approved Answer
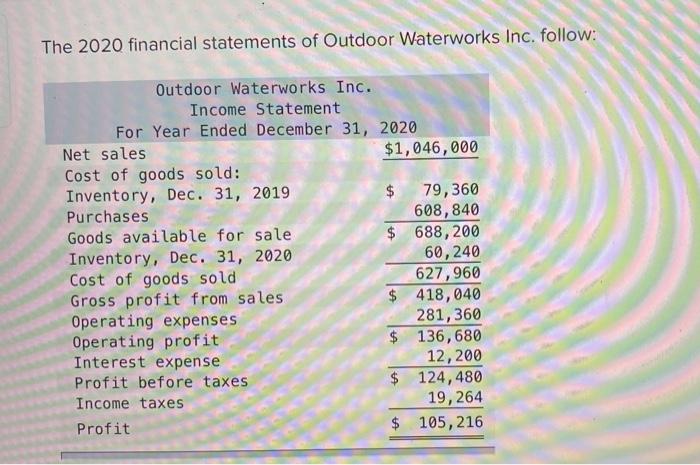
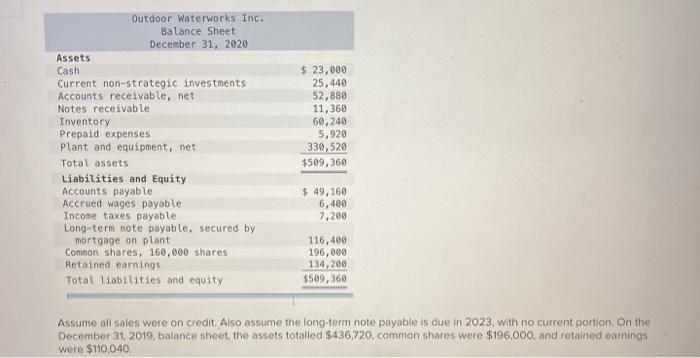
The 2020 financial statements of Outdoor Waterworks Inc. follow: Outdoor Waterworks Inc. Income Statement For Year Ended December 31, 2020 Net sales $1,046,000 Cost of
Step by Step Solution
There are 3 Steps involved in it
Step: 1

Get Instant Access to Expert-Tailored Solutions
See step-by-step solutions with expert insights and AI powered tools for academic success
Step: 2

Step: 3
Ace Your Homework with AI
Get the answers you need in no time with our AI-driven, step-by-step assistance
Get Started
Primary English Audit And Test
Authors: Sue Reid, Angela Sawyer, Mary Bennett-Hartley
4th Edition
1446282759, 978-1446282755