the 3 questions pelase!

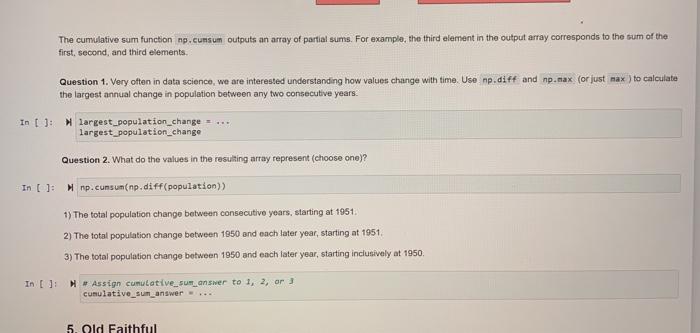
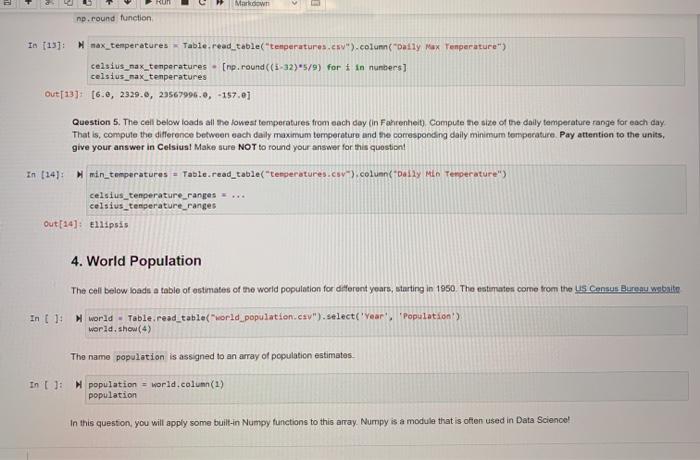
The cumulative sum function np.cunsum outputs an array of partial sums. For example, the third element in the output array corresponds to the sum of the first second, and third elements. Question 1. Very often in data science, we are interested understanding how values change with time. Use np.dift and np.max (or just max ) to calculate the largest annual change in population between any two consecutive years. In [ ]: P largest population change largest population_change Question 2. What do the values in the resulting array represent (choose one)? In [ ]: np.cunsum(np.diff(population) 1) The total population change between consecutive years, starting at 1951 2) The total population change between 1950 and each later year, starting at 1951 3) The total population change between 1950 and each later year, starting inclusively at 1950 In (): # Assign cumulative_surt answer to 1, 2, or cumulative_sum_answer 5. Old Faithful Markdown np. round function In (13) max_temperatures - Table,read table(temperatures.csv").column(Daily Max Tenperature") celsius_max_temperatures - (np.round((-32) "5/9) for in numbers) celsius_max_temperatures Out[13] [6.2, 2329.6, 23567996.0, -197.0] Question 5. The cell below loads all the lowest temperatures from each day (in Fahrenheit) Compute the size of the daily temperature range for each day That is, compute the difference between each daily maximum temperature and the corresponding daily minimum temperature. Pay attention to the units, give your answer in Celsius! Make sure NOT to round your answer for this quotion! In [14): min_temperatures = Table.read_table("temperatures.csv").colunn(Daily Min Tenperature") celsius_temperature_ranges ... celsius_tenperature_ranges Out[14] Ellipsis 4. World Population The cell below loads a table of estimates of the world population for different years, starting in 1950. The estimates come from the US Consus Bureau website In [ 1: N world. Table read_table(world_population.csv").select('Year's 'Population) world, show (4) The name population is assigned to an array of population estimates In ():N population = world.column(1) population In this question, you will apply some built-in Numpy functions to this array Numpy is a module that is often used in Data Science! The cumulative sum function np.cunsum outputs an array of partial sums. For example, the third element in the output array corresponds to the sum of the first second, and third elements. Question 1. Very often in data science, we are interested understanding how values change with time. Use np.dift and np.max (or just max ) to calculate the largest annual change in population between any two consecutive years. In [ ]: P largest population change largest population_change Question 2. What do the values in the resulting array represent (choose one)? In [ ]: np.cunsum(np.diff(population) 1) The total population change between consecutive years, starting at 1951 2) The total population change between 1950 and each later year, starting at 1951 3) The total population change between 1950 and each later year, starting inclusively at 1950 In (): # Assign cumulative_surt answer to 1, 2, or cumulative_sum_answer 5. Old Faithful Markdown np. round function In (13) max_temperatures - Table,read table(temperatures.csv").column(Daily Max Tenperature") celsius_max_temperatures - (np.round((-32) "5/9) for in numbers) celsius_max_temperatures Out[13] [6.2, 2329.6, 23567996.0, -197.0] Question 5. The cell below loads all the lowest temperatures from each day (in Fahrenheit) Compute the size of the daily temperature range for each day That is, compute the difference between each daily maximum temperature and the corresponding daily minimum temperature. Pay attention to the units, give your answer in Celsius! Make sure NOT to round your answer for this quotion! In [14): min_temperatures = Table.read_table("temperatures.csv").colunn(Daily Min Tenperature") celsius_temperature_ranges ... celsius_tenperature_ranges Out[14] Ellipsis 4. World Population The cell below loads a table of estimates of the world population for different years, starting in 1950. The estimates come from the US Consus Bureau website In [ 1: N world. Table read_table(world_population.csv").select('Year's 'Population) world, show (4) The name population is assigned to an array of population estimates In ():N population = world.column(1) population In this question, you will apply some built-in Numpy functions to this array Numpy is a module that is often used in Data Science


