

Question
The above code prodcues a graph of the cohen's d values of the column mentioned. for Max Speed. it give a Cohen's d for 7days,

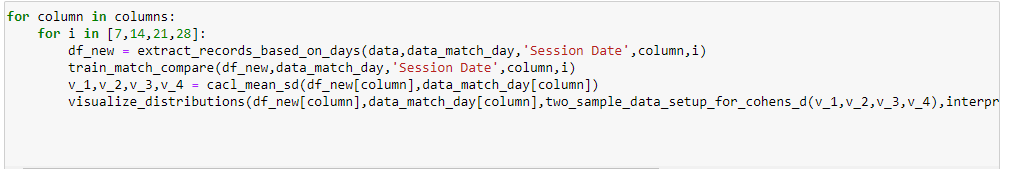
The above code prodcues a graph of the cohen's d values of the column mentioned. for Max Speed. it give a Cohen's d for 7days, 14days, 21days, and 2days. I need a fuction to that will create a df for all those columns with there cohen's d values for 7, 14,21 and 28days.
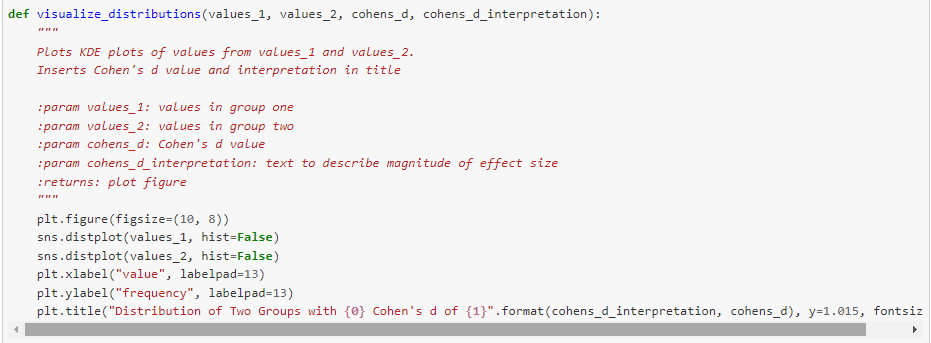
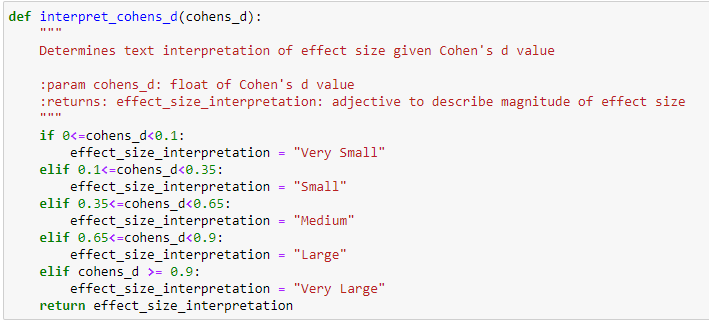
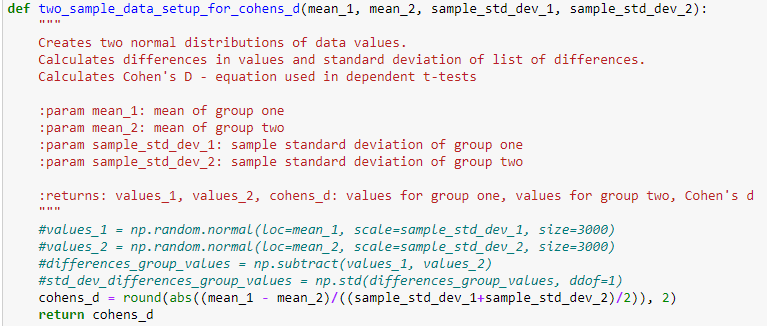
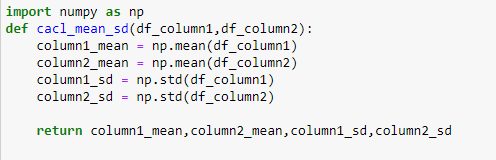
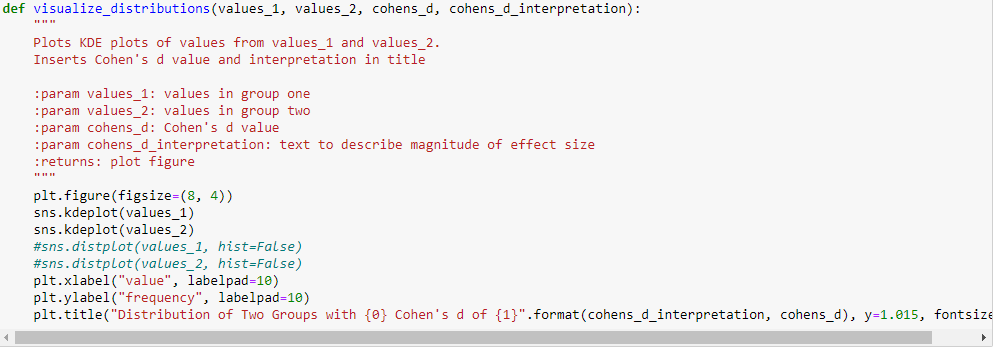
def visualize_distributions (values_1, values_2, cohens_d, cohens_d_interpretation): Plots KDE plots of values from values_1 and values_2. Inserts Cohen's d value and interpretation in title param values_1: values in group one param values_2: values in group two :param cohens_d: Cohen's d value :param cohens_d_interpretation: text to describe magnitude of effect size :returns: plot figure plt.figure(figsize=(10, 8)) sns.distplot(values_1, hist=False) sns.distplot(values_2, hist=False) plt.xlabel("value", labelpad=13) plt.ylabel("frequency", labelpad=13) plt.title("Distribution of Two Groups with {0} Cohen's d of {1}".format(cohens_d_interpretation, cohens_d), y=1.015, fontsiz def interpret_cohens_d(cohens_d): Determines text interpretation of effect size given Cohen's d value = :param cohens_d: float of Cohen's d value :returns: effect_size_interpretation: adjective to describe magnitude of effect size if = 0.9: effect_size_interpretation "Very Large" return effect_size_interpretation def two_sample_data_setup_for_cohens_d (mean_1, mean_2, sample_std_dev_1, sample_std_dev_2): Creates two normal distributions of data values. Calculates differences in values and standard deviation of list of differences. Calculates Cohen's D - equation used in dependent t-tests :param mean_1: mean of group one :param mean_2: mean of group two :param sample_std_dev_1: sample standard deviation of group one :param sample_std_dev_2: sample standard deviation of group two :returns: values_1, values_2, cohens_d: values for group one, values for group two, Cohen's d #values_1 = np.random.normal (Loc=mean_1, scale=sample_std_dev_1, size=3000) #values 2 = np.random.normal (Loc=mean_2, scale=sample_std_dev_2, size=3000) #differences_group_values np. subtract(values_1, values_2) #std_dev_differences_group_values np.std(differences_group_values, ddof=1) cohens_d = round(abs((mean_1 mean_2)/((sample_std_dev_1+sample_std_dev_2)/2)), 2) return cohens_d - import numpy as np def cacl_mean_sd(df_column1,df_column2): column1_mean np.mean(df_column1) column2_mean np.mean(df_column2) column1_sd = np.std (df_column1) column2_sd - np.std(df_column2) = return column1_mean, column2_mean, column1_sd, column2_sd def visualize_distributions (values_1, values_2, cohens_d, cohens_d_interpretation): Plots KDE plots of values from values_1 and values_2. Inserts Cohen's d value and interpretation in title :param values_1: values in group one :param values_2: values in group two :param cohens_d: Cohen's d value :param cohens_d_interpretation: text to describe magnitude of effect size :returns: plot figure plt.figure(figsize=(8, 4)) sns.kdeplot(values_1) sns.kdeplot(values_2) #sns.distplot(values_1, hist=False) #sns.distplot(values_2, hist=False) plt.xlabel("value", labelpad=10) plt.ylabel("frequency", labelpad=10) plt.title("Distribution of Two Groups with {@} Cohen's d of {1}".format(cohens_d_interpretation, cohens_d), y=1.015, fontsize columns ['Accelerations Zone 5', 'Decelerations Zone 5', 'Max Speed', 'Sprints'] # Need to check which more columns we need to add? for column in columns: for i in [7,14,21,28]: df_new = extract_records_based_on_days (data, data_match_day, 'Session Date', column,i) train_match_compare(df_new, data_match_day, 'Session Date',column, i) V_1,v_2,v_3,v_4 = cacl_mean_sd(df_new[column], data_match_day[column]) visualize_distributions(df_new[column], data_match_day[column], two_sample_data_setup_for_cohens_d(v_1,v_2,v_3,v_4), interprStep by Step Solution
There are 3 Steps involved in it
Step: 1

Get Instant Access to Expert-Tailored Solutions
See step-by-step solutions with expert insights and AI powered tools for academic success
Step: 2

Step: 3
Ace Your Homework with AI
Get the answers you need in no time with our AI-driven, step-by-step assistance
Get Started
Database Design Application And Administration
Authors: Michael Mannino, Michael V. Mannino
2nd Edition
0072880678, 9780072880670