

Answered step by step
Verified Expert Solution
Question
1 Approved Answer
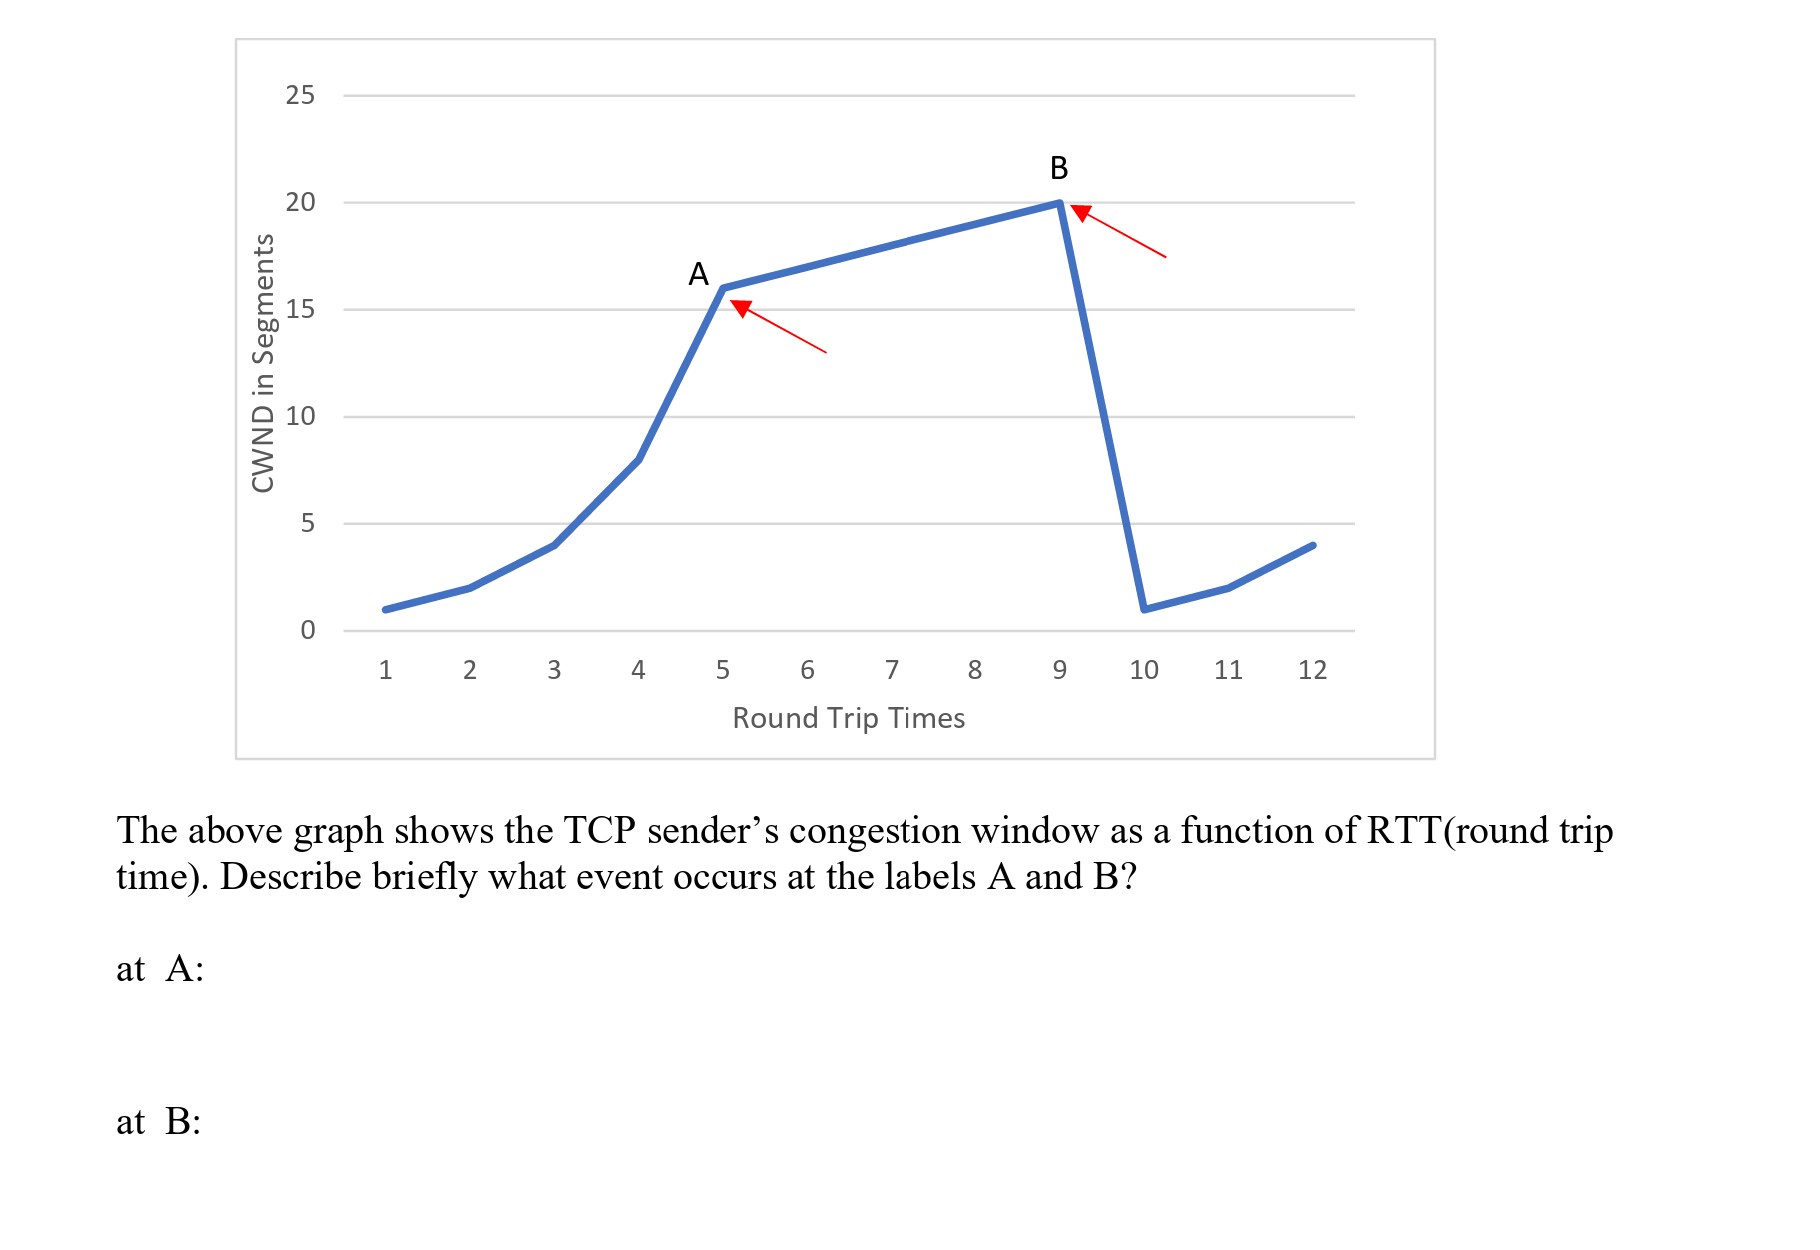
The above graph shows the TCP sender ' s congestion window as a function of RTT ( round trip time ) . Describe briefly what
The above graph shows the TCP senders congestion window as a function of RTTround trip time Describe briefly what event occurs at the labels A and B
at A:
at :
Step by Step Solution
There are 3 Steps involved in it
Step: 1

Get Instant Access to Expert-Tailored Solutions
See step-by-step solutions with expert insights and AI powered tools for academic success
Step: 2

Step: 3
Ace Your Homework with AI
Get the answers you need in no time with our AI-driven, step-by-step assistance
Get Started
Time Series Databases New Ways To Store And Access Data
Authors: Ted Dunning, Ellen Friedman
1st Edition
1491914726, 978-1491914724