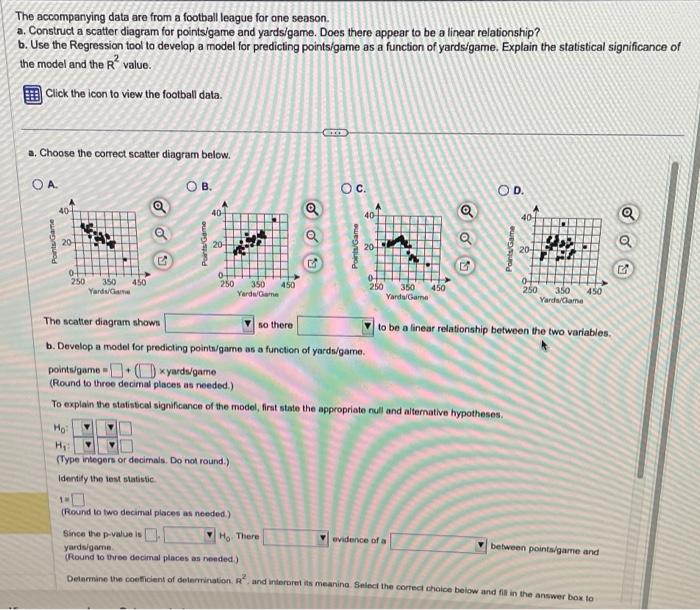
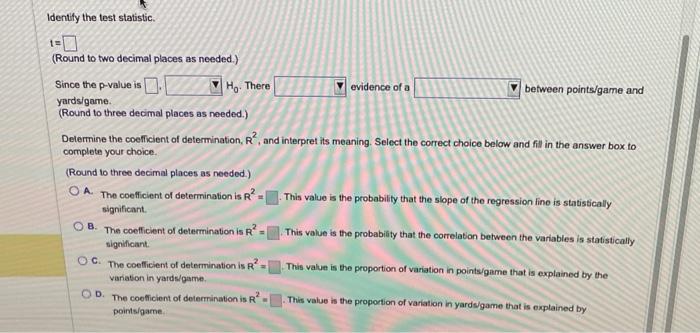
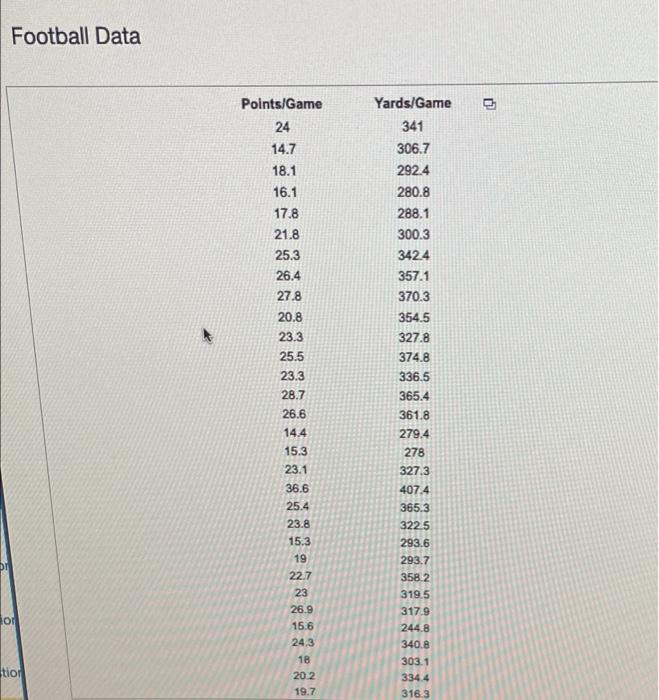
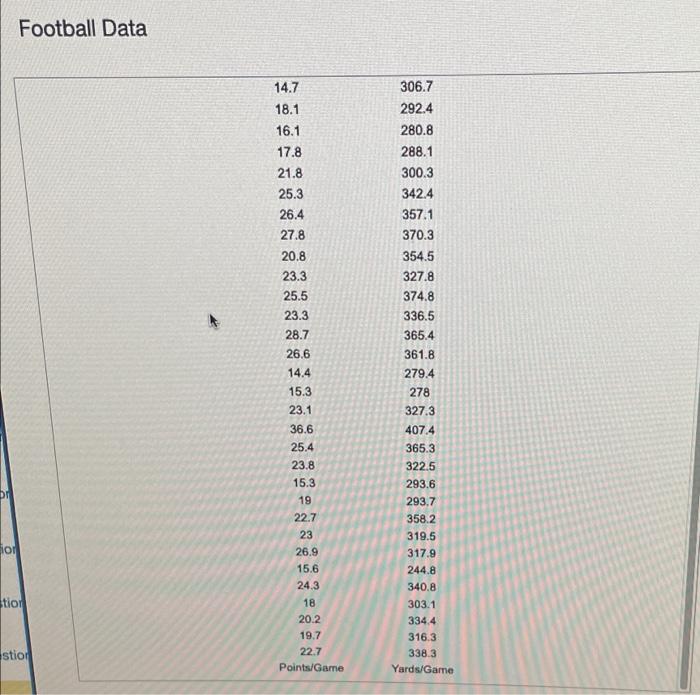
The accompanying data are from a football league for one season. a. Construct a scatter diagram for pointsigame and yards/game. Does there appear to be a linear relationship? b. Use the Regression tool to develop a model for predicting pointsigame as a function of yards/game. Explain the statistical significance of the model and the R2 value. a. Choose the correct scatter diagram below. b. Develop a model for predicting pointn/game as a function of yards/game. points/game = +1. Xyardsigame (Round to throe decimal places as needed.) To explain the statistical significance of the model, first state the appropriate null and alternative hypotheses. (Round to two decimal places as needed.) Since the p-value is yardsigame. (Round to three decimal places as needed.) Delermine the coeficient of determination, R2, and interpret its meaning. Select the correct choice below and fill in the answer box to complete your choice. (Round to three decimal places as needed.) A. The coefficient of determination is R2=. This value is the probability that the slope of the regression fine is statistically significant. B. The coefficient of determination is R2=. This value is the probability that the correlation between the variables is statistically signilicant: C. The coefficient of determination is R2=. This value is the proportion of variation in points/game that is explained by the variation in yards/game. D. The coeflicient of deterrrination is R2= This value is the proportion of variation in yardsgame that is explained by points/game. Football Data Football Data The accompanying data are from a football league for one season. a. Construct a scatter diagram for pointsigame and yards/game. Does there appear to be a linear relationship? b. Use the Regression tool to develop a model for predicting pointsigame as a function of yards/game. Explain the statistical significance of the model and the R2 value. a. Choose the correct scatter diagram below. b. Develop a model for predicting pointn/game as a function of yards/game. points/game = +1. Xyardsigame (Round to throe decimal places as needed.) To explain the statistical significance of the model, first state the appropriate null and alternative hypotheses. (Round to two decimal places as needed.) Since the p-value is yardsigame. (Round to three decimal places as needed.) Delermine the coeficient of determination, R2, and interpret its meaning. Select the correct choice below and fill in the answer box to complete your choice. (Round to three decimal places as needed.) A. The coefficient of determination is R2=. This value is the probability that the slope of the regression fine is statistically significant. B. The coefficient of determination is R2=. This value is the probability that the correlation between the variables is statistically signilicant: C. The coefficient of determination is R2=. This value is the proportion of variation in points/game that is explained by the variation in yards/game. D. The coeflicient of deterrrination is R2= This value is the proportion of variation in yardsgame that is explained by points/game. Football Data Football Data


