

Answered step by step
Verified Expert Solution
Question
1 Approved Answer
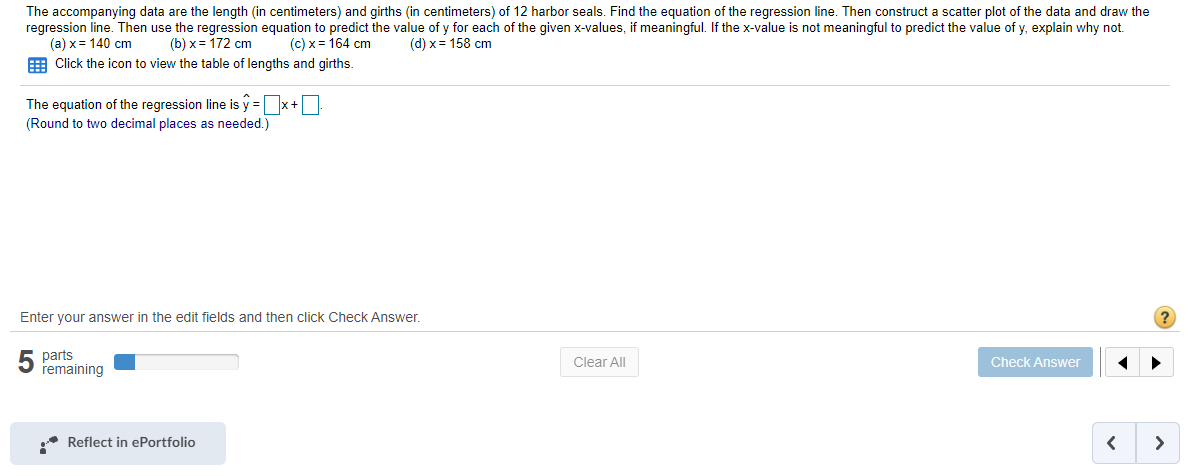
The accompanying data are the length (in centimeters) and girths (in centimeters) oHZ harbor seals Find the equation of the regression line Then constmct a
Step by Step Solution
There are 3 Steps involved in it
Step: 1

Get Instant Access to Expert-Tailored Solutions
See step-by-step solutions with expert insights and AI powered tools for academic success
Step: 2

Step: 3
Ace Your Homework with AI
Get the answers you need in no time with our AI-driven, step-by-step assistance
Get Started