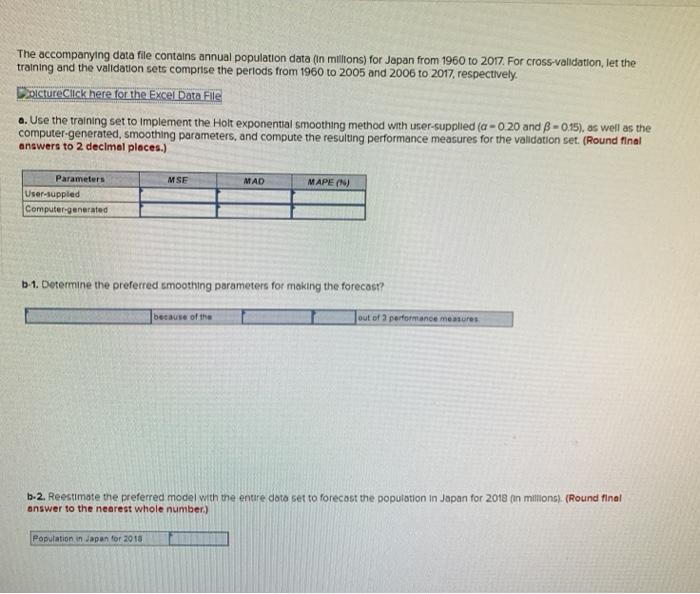
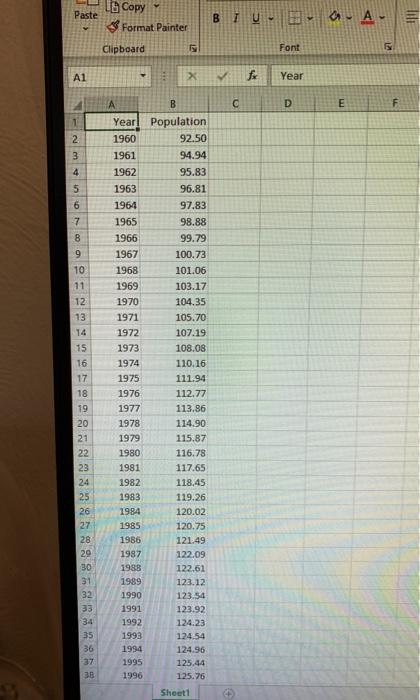
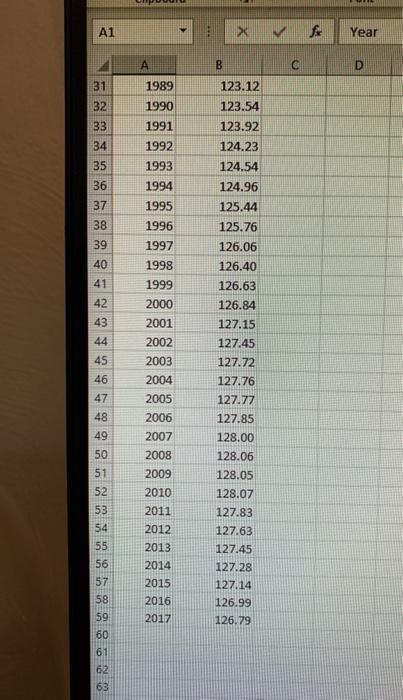
The accompanying data file contains annual population data (in millions) for Japan from 1960 to 2017. For cross-validation, let the training and the validation sets comprise the periods from 1960 to 2005 and 2006 to 2017, respectively. DeictureClick here for the Excel Data File a. Use the training set to Implement the Holt exponential smoothing method with user-supplied (a -0.20 and 8-0.35), as well as the computer-generated, smoothing parameters, and compute the resulting performance measures for the validation set. (Round final answers to 2 decimal places.) MSE MAD MAPEN) Parameters User-suppled Computer generated b-1. Determine the preferred smoothing parameters for making the forecas? because of the out of a performance measures b-2. Reestimate the preferred model with the entire data set to forecast the population in Japan for 2018 (in millions). (Round final answer to the nearest whole number.) Population in Japan for 2018 LECopy Paste & Format Painter B i U. B. lili Clipboard 5 Font A1 X fr Year D E F 1 2 3 5 6 7 8 9 10 11 12 13 14 15 16 17 18 19 20 21 22 23 24 25 26 27 28 29 30 31 32 33 A B Yearl Population 1960 92.50 1961 94.94 1962 95.83 1963 96.81 1964 97.83 1965 98.88 1966 99.79 1967 100.73 1968 101.06 1969 103.17 1970 104.35 1971 105.70 1972 107.19 1973 108.08 1974 110.16 1975 111.94 1976 112.77 1977 113.86 1978 114.90 1979 115.87 1980 116.78 1981 117.65 1982 118.45 1983 119.26 1984 120.02 1985 120.75 1986 121.49 1987 122.09 1988 122.61 1989 123.12 1990 123.54 1991 123.92 1992 124.23 1993 124.54 1994 124.96 1995 125.44 1996 125.76 34 35 36 37 3B Sheet1 A1 > Year A B C D 123.12 31 32 1989 1990 123.54 1991 123.92 124.23 1992 1993 124.54 1994 124.96 1995 125.44 38 125.76 39 126.06 40 126.40 41 126.63 42 43 44 45 46 47 48 49 1996 1997 1998 1999 2000 2001 2002 2003 2004 2005 2006 50 51 2007 2008 2009 126.84 127.15 127.45 127.72 127.76 127.77 127.85 128.00 128.06 128.05 128.07 127.83 127.63 127.45 127.28 127.14 126.99 126.79 52 53 54 55 56 57 58 59 60 61 62 63 2010 2011 2012 2013 2014 2015 2016 2017 The accompanying data file contains annual population data (in millions) for Japan from 1960 to 2017. For cross-validation, let the training and the validation sets comprise the periods from 1960 to 2005 and 2006 to 2017, respectively. DeictureClick here for the Excel Data File a. Use the training set to Implement the Holt exponential smoothing method with user-supplied (a -0.20 and 8-0.35), as well as the computer-generated, smoothing parameters, and compute the resulting performance measures for the validation set. (Round final answers to 2 decimal places.) MSE MAD MAPEN) Parameters User-suppled Computer generated b-1. Determine the preferred smoothing parameters for making the forecas? because of the out of a performance measures b-2. Reestimate the preferred model with the entire data set to forecast the population in Japan for 2018 (in millions). (Round final answer to the nearest whole number.) Population in Japan for 2018 LECopy Paste & Format Painter B i U. B. lili Clipboard 5 Font A1 X fr Year D E F 1 2 3 5 6 7 8 9 10 11 12 13 14 15 16 17 18 19 20 21 22 23 24 25 26 27 28 29 30 31 32 33 A B Yearl Population 1960 92.50 1961 94.94 1962 95.83 1963 96.81 1964 97.83 1965 98.88 1966 99.79 1967 100.73 1968 101.06 1969 103.17 1970 104.35 1971 105.70 1972 107.19 1973 108.08 1974 110.16 1975 111.94 1976 112.77 1977 113.86 1978 114.90 1979 115.87 1980 116.78 1981 117.65 1982 118.45 1983 119.26 1984 120.02 1985 120.75 1986 121.49 1987 122.09 1988 122.61 1989 123.12 1990 123.54 1991 123.92 1992 124.23 1993 124.54 1994 124.96 1995 125.44 1996 125.76 34 35 36 37 3B Sheet1 A1 > Year A B C D 123.12 31 32 1989 1990 123.54 1991 123.92 124.23 1992 1993 124.54 1994 124.96 1995 125.44 38 125.76 39 126.06 40 126.40 41 126.63 42 43 44 45 46 47 48 49 1996 1997 1998 1999 2000 2001 2002 2003 2004 2005 2006 50 51 2007 2008 2009 126.84 127.15 127.45 127.72 127.76 127.77 127.85 128.00 128.06 128.05 128.07 127.83 127.63 127.45 127.28 127.14 126.99 126.79 52 53 54 55 56 57 58 59 60 61 62 63 2010 2011 2012 2013 2014 2015 2016 2017