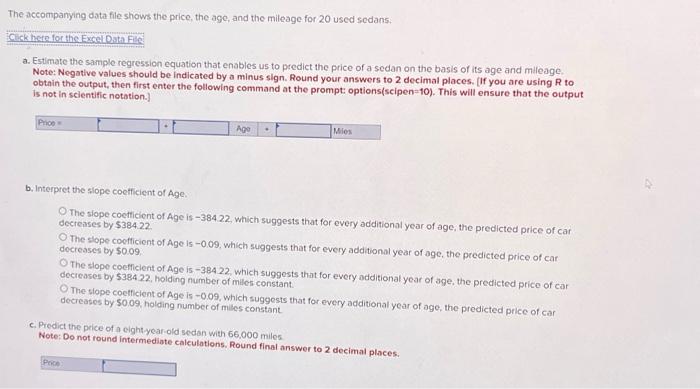
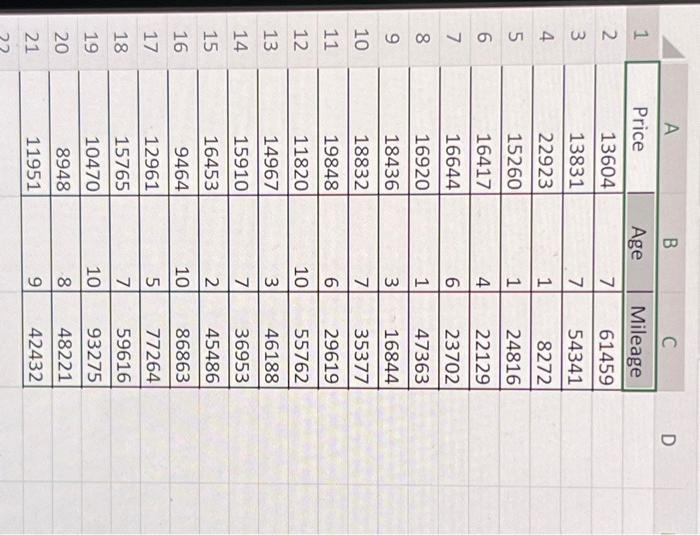
The accompanying data file shows the price, the age, and the mileage for 20 used sedans. a. Estimate the sample regression equation that enables us to predict the price of a sedan on the basis of its age and mileage. Note: Negative values should be indicated by a minus sign. Round your answers to 2 decimal places. (If you are using R to obtain the output, then first enter the following command at the prompt: options(scipen=10). This will ensure that the output is not in scientific notation.] b. Interpret the slope coefficient of Age. The slope coetticient of Age is -384.22 , which suggests that for every additional year of age, the predicted price of car decreases by $384.22. The slope coefficient of Age is -0.09 , which suggests that for every additional year of age, the predicted price of car docreases by $0.09 The slope coefficient of Age is -384.22 , which suggest decieases by $38422, holding number of miles constant. The slope coefficient of Age is -0.09 , which suggests that for every additional year of age, the predicted price of car decreases by 50.09 , holding number of miles constant. c. Predict the peice of a eight year old sedan with 66,000 miles Note: Do not round intermediate calculations. Round final answer to 2 decimal places. \begin{tabular}{|c|c|c|c|} \hline 4 & A & B & C \\ \hline 1 & Price & Age & Mileage \\ \hline 2 & 13604 & 7 & 61459 \\ \hline 3 & 13831 & 7 & 54341 \\ \hline 4 & 22923 & 1 & 8272 \\ \hline 5 & 15260 & 1 & 24816 \\ \hline 6 & 16417 & 4 & 22129 \\ \hline 7 & 16644 & 6 & 23702 \\ \hline 8 & 16920 & 1 & 47363 \\ \hline 9 & 18436 & 3 & 16844 \\ \hline 10 & 18832 & 7 & 35377 \\ \hline 11 & 19848 & 6 & 29619 \\ \hline 12 & 11820 & 10 & 55762 \\ \hline 13 & 14967 & 3 & 46188 \\ \hline 14 & 15910 & 7 & 36953 \\ \hline 15 & 16453 & 2 & 45486 \\ \hline 16 & 9464 & 10 & 86863 \\ \hline 17 & 12961 & 5 & 77264 \\ \hline 18 & 15765 & 7 & 59616 \\ \hline 19 & 10470 & 10 & 93275 \\ \hline 20 & 8948 & 8 & 48221 \\ \hline 21 & 11951 & 9 & 42432 \\ \hline \end{tabular}