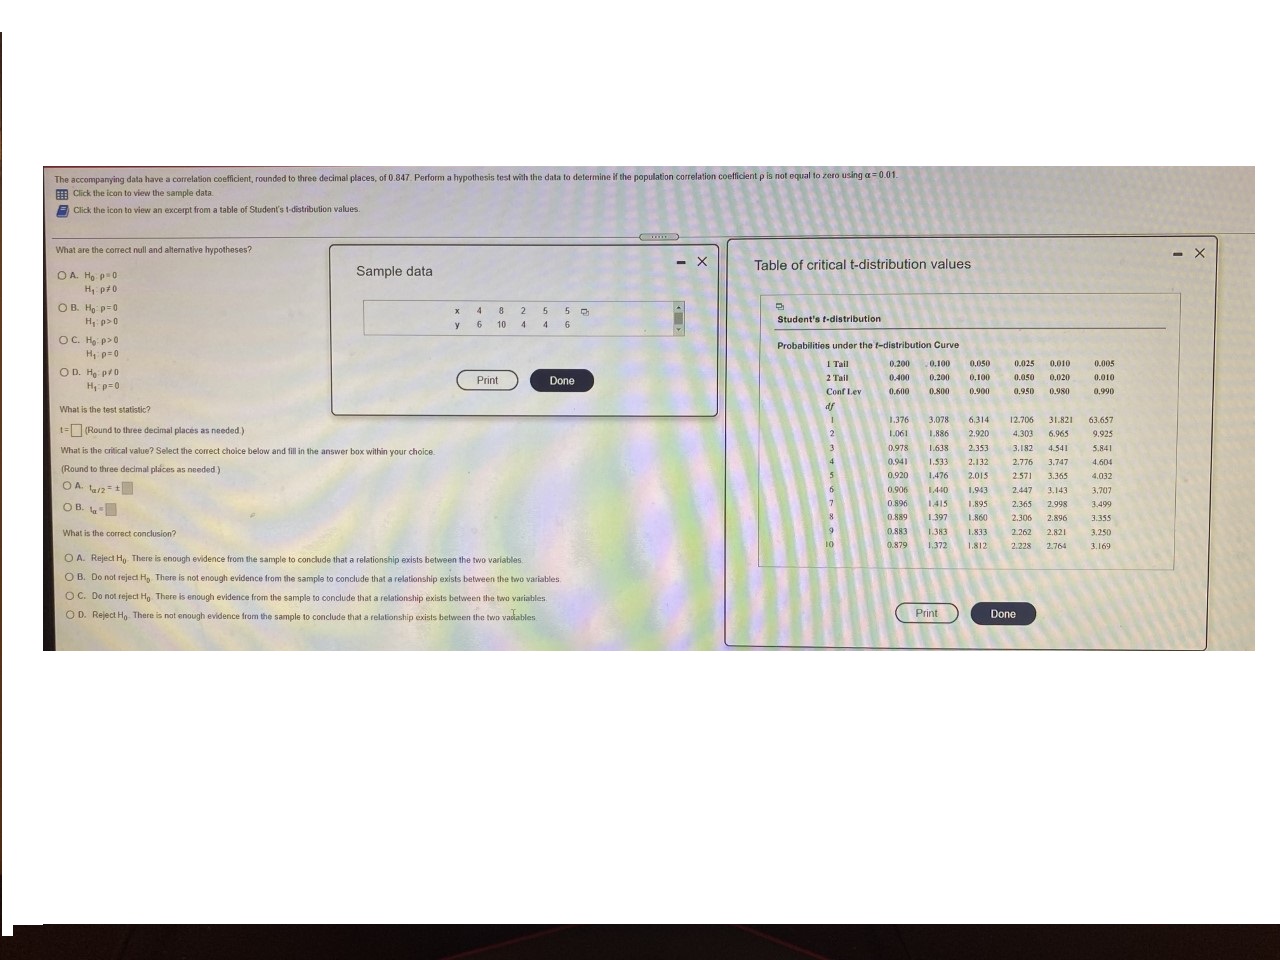
The accompanying data have a correlation coefficient, rounded to three decimal places, of 0.847. Perform a hypothesis test with the data to determine if the population correlation coefficient p is not equal to zero using a= 0.01. If Click the icon to view the sample data. Click the icon to view an excerpt from a table of Student's 1-distribution values. X What are the correct null and alternative hypotheses? X Table of critical t-distribution values OA. Hop=0 Sample data H1 P70 OB. Ho P=0 6 10 5 Student's t-distribution O C. Ho p>0 Probabilities under the f-distribution Curve H1 P=0 1 Tail 0.200 0,100 0,050 0.025 0,010 0.005 2 Tail 0.400 0.200 0.100 0.050 0,020 0,010 OD. He pro Print Done Conf Lev 0.600 0-800 0.900 0.950 1980 0.990 H1 P=0 What is the test statistic? 1.376 3,078 6,314 12.706 31.821 63.657 1= (Round to three decimal places as needed ) 1.061 1,880 2,920 4,303 6.965 9.925 0.978 1.635 2.353 3.182 4541 5.841 What is the critical value? Select the correct choice below and fill in the answer box within your choice. 0.941 1.533 2.132 2.776 3.747 4.604 0.920 1.470 2015 2.571 4.032 (Round to three decimal places as needed ) 0.906 1.4:40 1.943 2.447 3.143 3.707 OA ta/2= 0.896 1415 1.895 2.365 2.998 1.499 OB. la " 0.889 1.397 1:860 2.306 2.896 3.355 0.883 1.383 1.833 2.262 2.821 3.250 What is the correct conclusion? 0.879 1.372 1.812 2.228 2764 3.160 O A. Reject Ho. There is enough evidence from the sample to conclude that a relationship exists between the two variables. O B. Do not reject Ho There is not enough e elationship exists between the two variables. O C. Do not reject Ho There is enough evidence from relationship exists between the two variables. Print Done O D. Reject Ho There is not enough evidence from the sample to conclude that a relationship exists between the two vadables