

Answered step by step
Verified Expert Solution
Question
1 Approved Answer
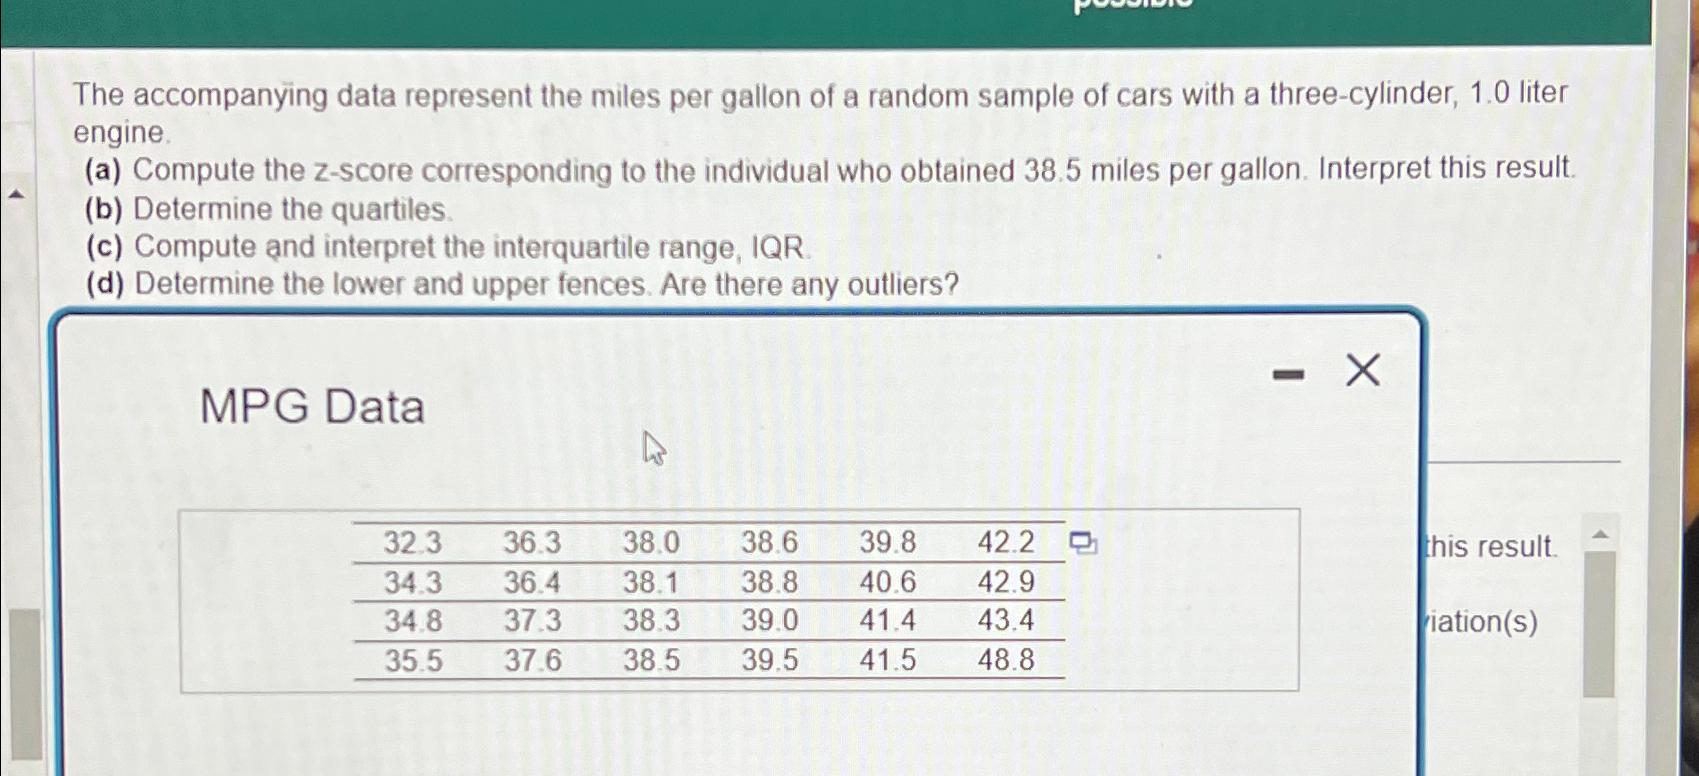
The accompanying data represent the miles per gallon of a random sample of cars with a three - cylinder, 1 . 0 liter engine. (
The accompanying data represent the miles per gallon of a random sample of cars with a threecylinder, liter engine.
a Compute the score corresponding to the individual who obtained miles per gallon. Interpret this result.
b Determine the quartiles.
c Compute and interpret the interquartile range, IQR.
d Determine the lower and upper fences. Are there any outliers?
MPG Data
table
this result.
iations
Step by Step Solution
There are 3 Steps involved in it
Step: 1

Get Instant Access to Expert-Tailored Solutions
See step-by-step solutions with expert insights and AI powered tools for academic success
Step: 2

Step: 3
Ace Your Homework with AI
Get the answers you need in no time with our AI-driven, step-by-step assistance
Get Started
Elementary Statisitcs
Authors: Barry Monk
2nd edition
1259345297, 978-0077836351, 77836359, 978-1259295911, 1259295915, 978-1259292484, 1259292487, 978-1259345296