

Answered step by step
Verified Expert Solution
Question
1 Approved Answer
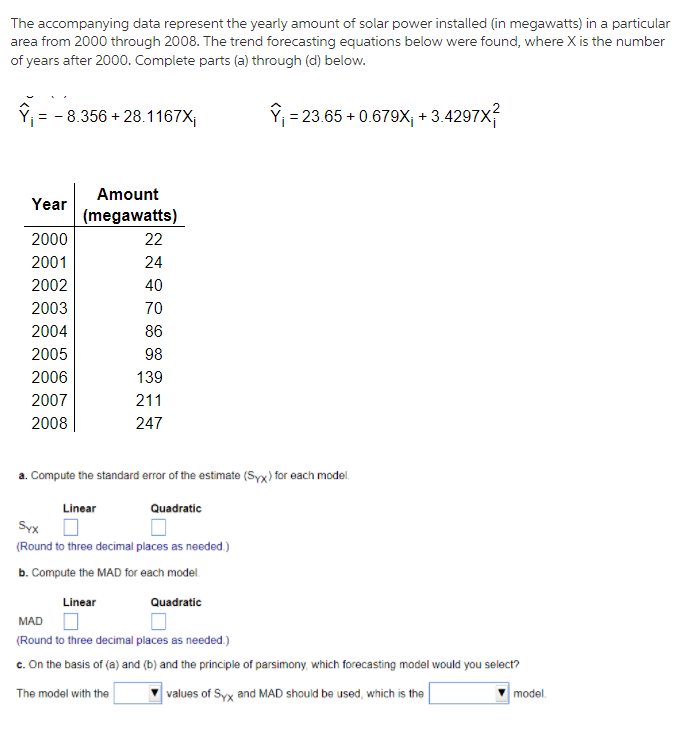
The accompanying data represent the yearly amount of solar power installed (in megawatts) in a particular area from 2000 through 2008. The trend forecasting equations

Step by Step Solution
There are 3 Steps involved in it
Step: 1

Get Instant Access to Expert-Tailored Solutions
See step-by-step solutions with expert insights and AI powered tools for academic success
Step: 2

Step: 3
Ace Your Homework with AI
Get the answers you need in no time with our AI-driven, step-by-step assistance
Get Started
Sacred Mathematics Japanese Temple Geometry
Authors: Fukagawa Hidetoshi, Tony Rothman, Freeman Dyson
1st Edition
1400829712, 9781400829712