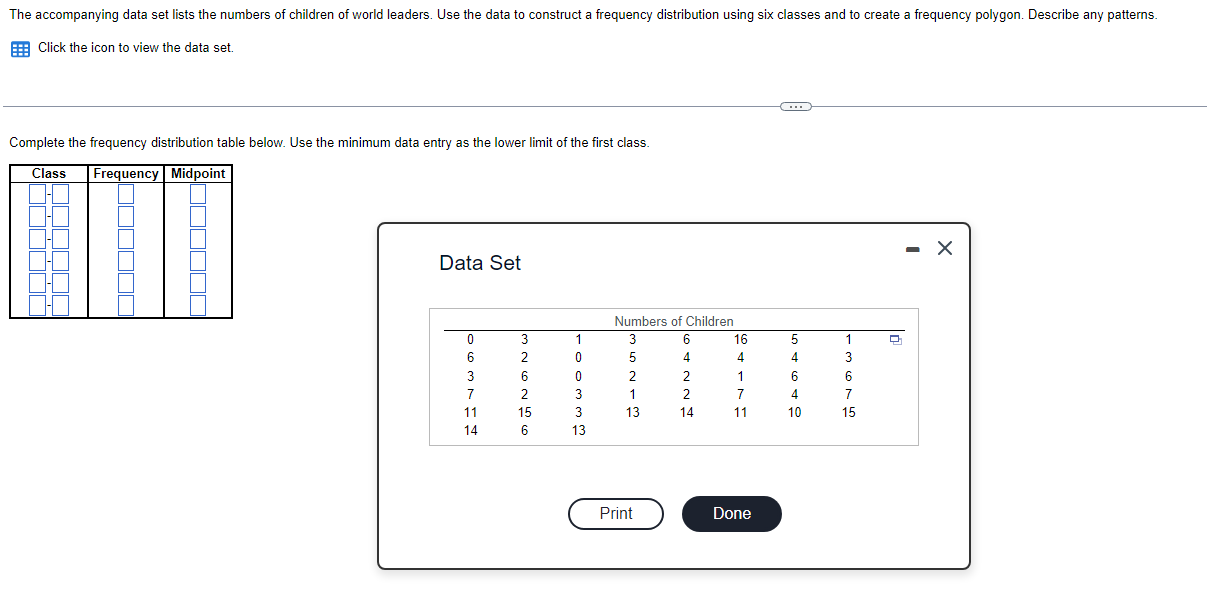
The accompanying data set lists the numbers of children of world leaders. Use the data to construct a frequency distribution using six classes and to
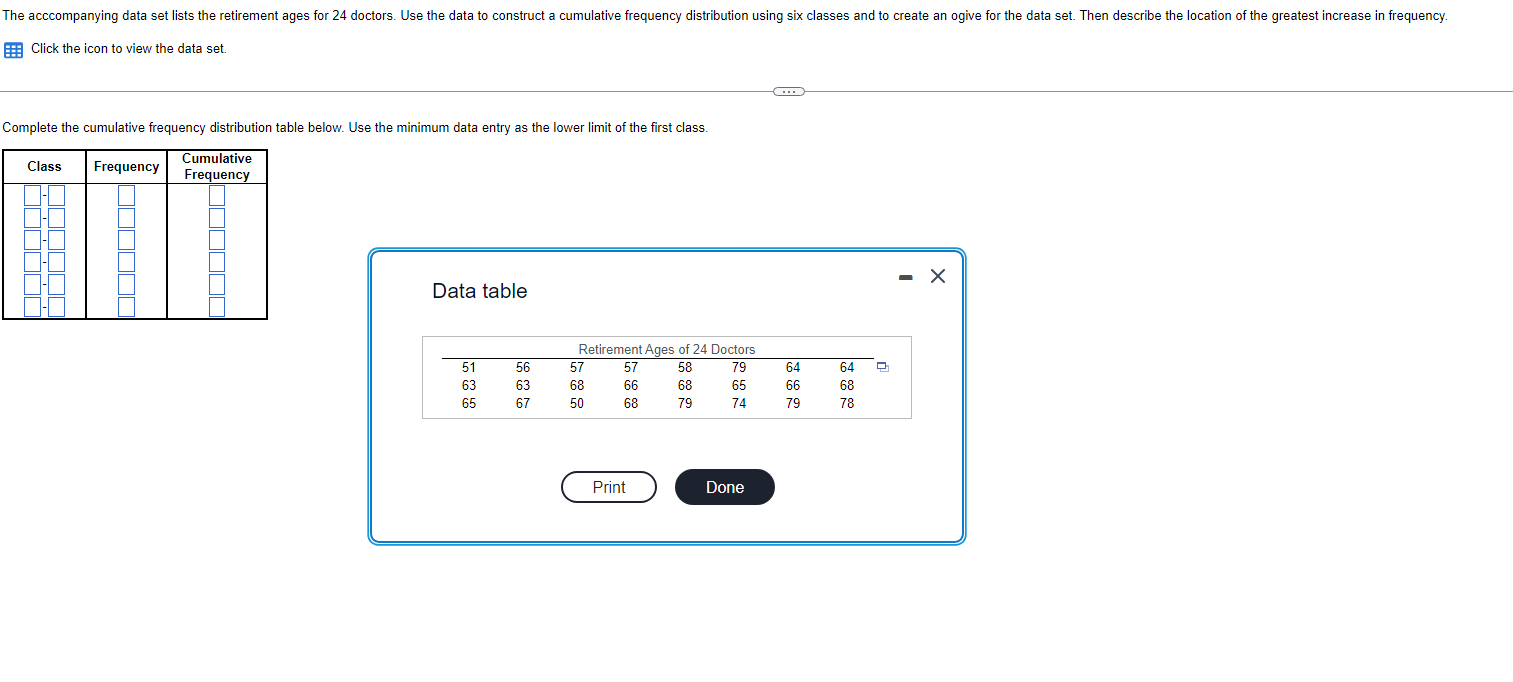
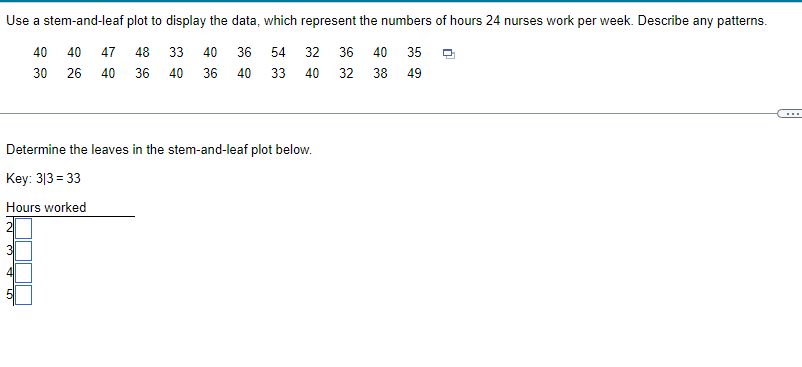
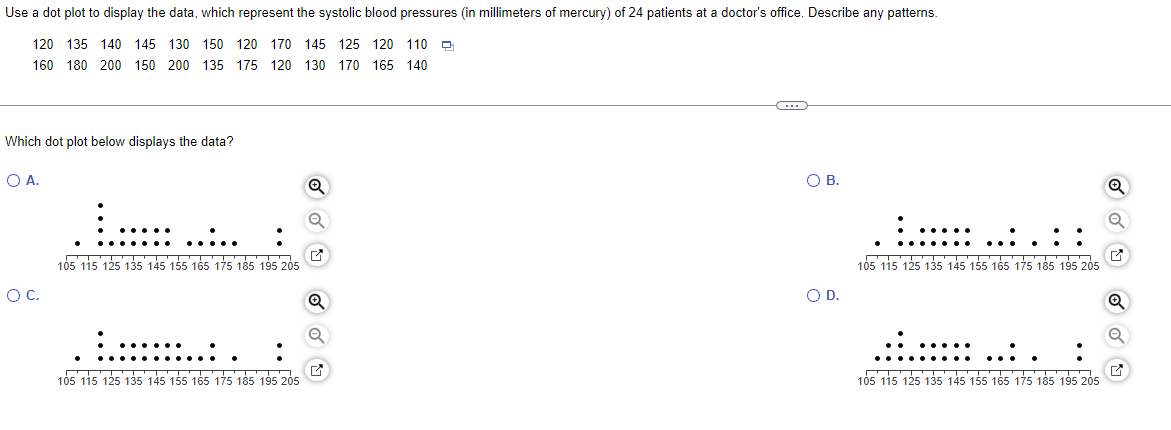
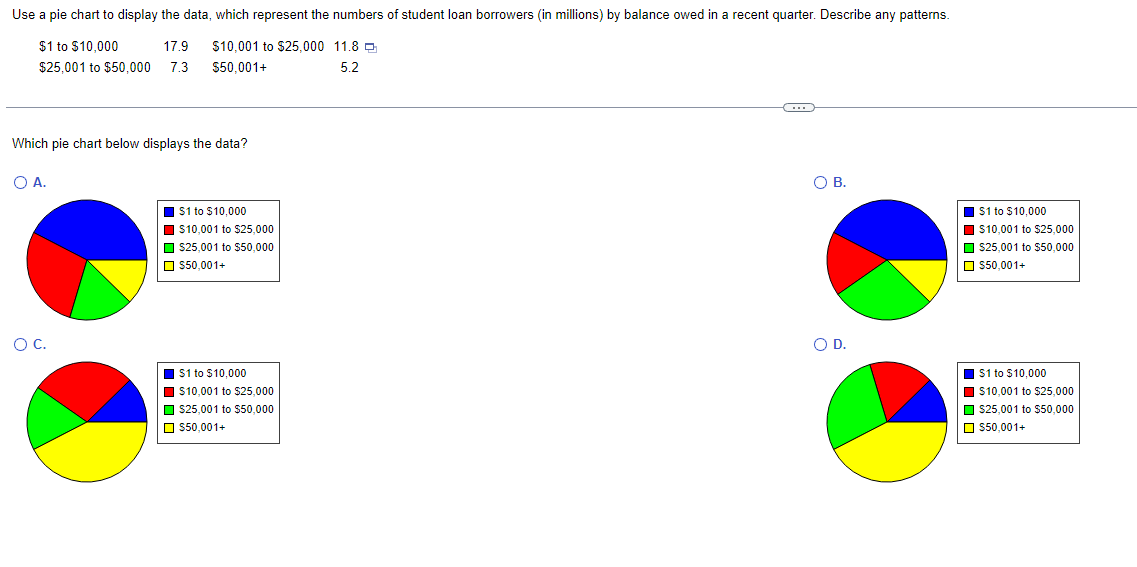
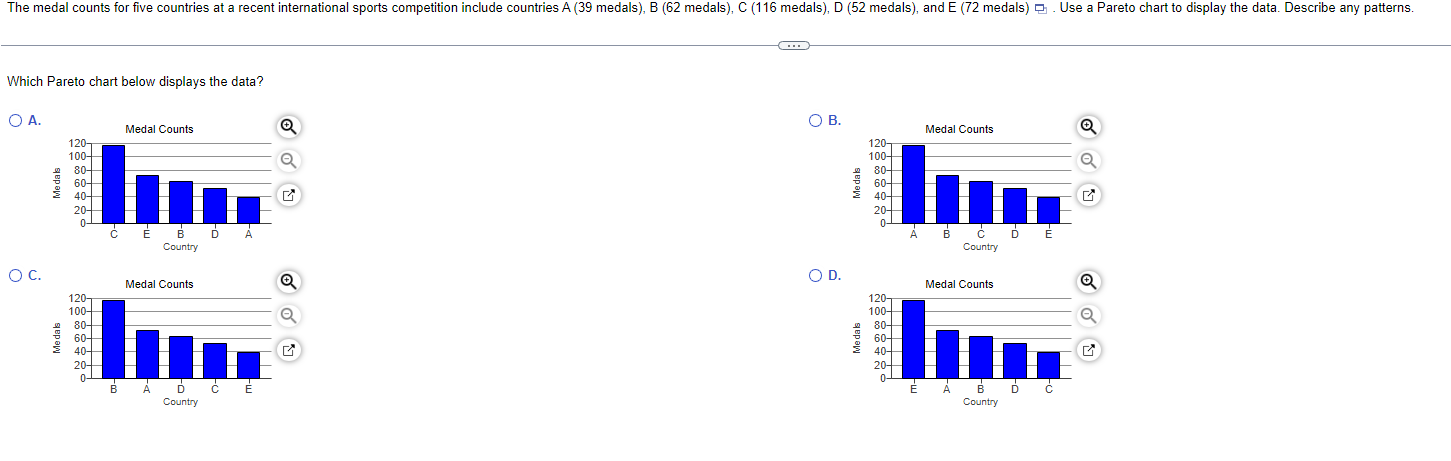
The accompanying data set lists the numbers of children of world leaders. Use the data to construct a frequency distribution using six classes and to create a frequency pelygen. Describe any patterns. EFH Click the icon to view the data set Complete the frequency distribution table below. Use the minimum data entry as the lower limit of the first class. uency | Mi Numbers of Children 3 B 15 5 4 4 2 2 1 1 2 7 14 11 CrO The acccompanying data set lists the retirement ages for 24 doctors. Use the data to construct a cumulative frequency distribution using six classes and to create an ogive for the data set. Then describe the location of the greatest increase in frequency. E Click the icon to view the data set. Complete the cumulative frequency distribution table below. Use the minimum data entry as the lower limit of the first class. Cumulative Frequency Frequency Data table Retirement Ages of 24 Doctors 57 57 58 79 64 58 66 52 65 66 50 68 79 74 75 G 2B Use a stem-and-leaf plot to display the data, which represent the numbers of hours 24 nurses work per week. Describe any patterns. 40 40 47 48 33 40 36 54 32 38 40 3 o 30 26 40 36 40 36 40 33 40 32 3@ 49 Determine the leaves in the stem-and-leaf plot below. Key: 3|3=33 Hours worked | N n n Use a dot plot to display the data, which represent the systolic blood pressures (in millimeters of mercury) of 24 patients at a doctor's office. Describe any patterns. 120 135 140 145 130 150 120 170 145 125 120 110 160 180 200 150 200 135 175 120 130 170 165 140 Which dot plot below displays the data? O A. OB. Q 105 115 125 135 145 155 165 175 185 195 205 105 115 125 135 145 155 165 175 185 195 205 O C. OD. 105 115 125 135 145 155 165 175 185 195 205 105 115 125 135 145 155 165 175 185 195 205Use a pie chart to display the data, which represent the numbers of student loan borrowers (in millions) by balance owed in a recent quarter. Describe any patterns. 5110 $10,000 17.9 510,001to $25.000 11.8 o $25,001t0 50,000 7.3 $50,001+ 5.2 Which pie chart below displays the data? ,::'::, A. e W 3110 510,000 W 510,001 to 525,000 525,001 to 550,000 550,001+ W 5180 3510,000 W 510,001 to 525,000 525,001 to 550,000 530,001+ W 5180 3510,000 W 510,001 to 525,000 525,001 to 550,000 550,001+ W 5180 510,000 W 510,001 to 525,000 525,001 to 550,000 530,001+ The medal counts for five countries at a recent international sports competition include countries A (39 medals), B (62 medals), C (116 medals), D (52 medals), and E (72 medals) . Use a Pareto chart to display the data. Describe any patterns. Which Pareto chart below displays the data? O B. O A. Medal Counts Medal Counts 120- 120 100- 100- 80- 80- 60- Medals 40- 40- 20- 20- A B C D E C E B D A Country Country O C. O D. Medal Counts Medal Counts 120- 120- 100- 100 80- 80- e dabs 60- Medals 60 40- 40- 20- 20- TO TO E A B D C B A D C F Country Country
Step by Step Solution
There are 3 Steps involved in it
Step: 1
Get Instant Access to Expert-Tailored Solutions
See step-by-step solutions with expert insights and AI powered tools for academic success
Step: 2
Step: 3
Ace Your Homework with AI
Get the answers you need in no time with our AI-driven, step-by-step assistance