

Question
The accompanying data table shows the level of social media networking?(measured as the percent of individuals polled who use social networking?sites) and the GDP at
The accompanying data table shows the level of social media networking?(measured as the percent of individuals polled who use social networking?sites) and the GDP at purchasing power parity?(PPP) per capita for each of 24 selected countries.
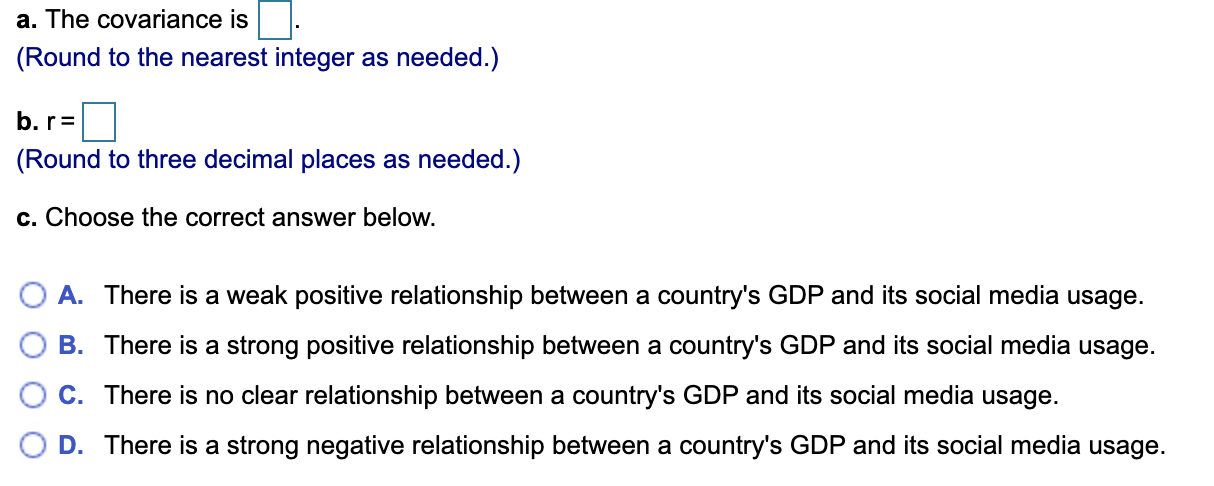
a.
Compute the covariance.
b.
Compute the coefficient of correlation.
c.
Based on parts?(a) and?(b), what conclusions can be reached about the relationship between the GDP and social media?use?
LOADING...
Click the icon to view the table of the?countries' GDP and social media usage.
GDP (PPP) Social Media Usage (%)
6,908 86
17,801 87
5,034 86
10,012 84
6,054 84
6,650 81
14,041 84
3,971 80
15,823 77
4,687 77
16,317 79
19,870 72
18,171 72
3,344 71
19,312 74
7,989 75
4,002 72
13,651 72
16,995 68
6,528 69
6,771 67
6,438 66
Step by Step Solution
There are 3 Steps involved in it
Step: 1

Get Instant Access to Expert-Tailored Solutions
See step-by-step solutions with expert insights and AI powered tools for academic success
Step: 2

Step: 3
Ace Your Homework with AI
Get the answers you need in no time with our AI-driven, step-by-step assistance
Get Started
Finite Math And Applied Calculus
Authors: Stefan Waner, Steven Costenoble
6th Edition
1285415132, 9781285415130