

Question
The accompanying scatterplot shows the growth (in % of Gross Domestic Product) of the developing countries vs. the growth of developed countries for a particular
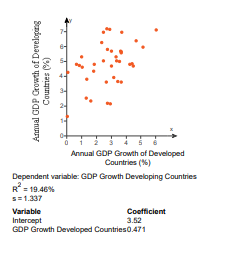
The accompanying scatterplot shows the growth (in % of Gross Domestic Product) of the developing countries vs. the growth of developed countries for a particular region. Each point represents one of the years from 1970 to 2007. The output of a regression analysis follows the scatterplot. Complete parts a and b below.
LOADING...
Click the icon to view the scatterplot and the output of the regression analysis.
Question content area bottom
Part 1
a) Check the assumptions and conditions for the linear model. What assumptions and conditions are met?
A.
All of the assumptions and conditions are met. The variables are both quantitative (with units % of GDP), the plot is reasonably straight, there are no outliers, and the spread is roughly constant (although the spread is large).
B.
All of the assumptions and conditions are met with the exception of the condition that there are no outliers (there are a total of three outliers in the scatterplot).
C.
All of the assumptions and conditions are met with the exception of the quantitative variables condition; the data are categorical.
D.
All of the assumptions and conditions are met with the exception of the linearity condition; the points do not follow a straight line pattern (as evidenced by the
R2-value).
Part 2
b) Explain the meaning of
R2
in this context.
A.
About
19%
of the variation in the growth rates of developing countries is caused by the growth rates of developed countries.
B.
About
19%
of the variation in the growth rates of developing countries is accounted for by the growth rates of developed countries.
C.
About
19%
of the growth rates of developing countries are accounted for by the growth rates of developed countries.
D.
About
19%
of the variation in the growth rates of developed countries is caused by the growth rates of developing countries.
Step by Step Solution
There are 3 Steps involved in it
Step: 1

Get Instant Access to Expert-Tailored Solutions
See step-by-step solutions with expert insights and AI powered tools for academic success
Step: 2

Step: 3
Ace Your Homework with AI
Get the answers you need in no time with our AI-driven, step-by-step assistance
Get Started
Algebra And Trigonometry Enhanced With Graphing Utilities (Subscription)
Authors: Michael Sullivan, Michael Sullivan III
7th Edition
0134273842, 9780134273846