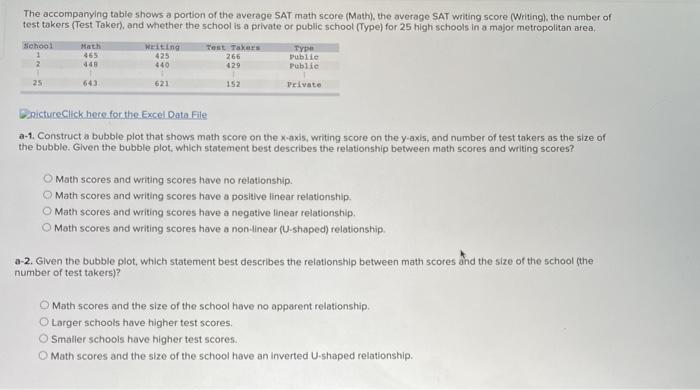
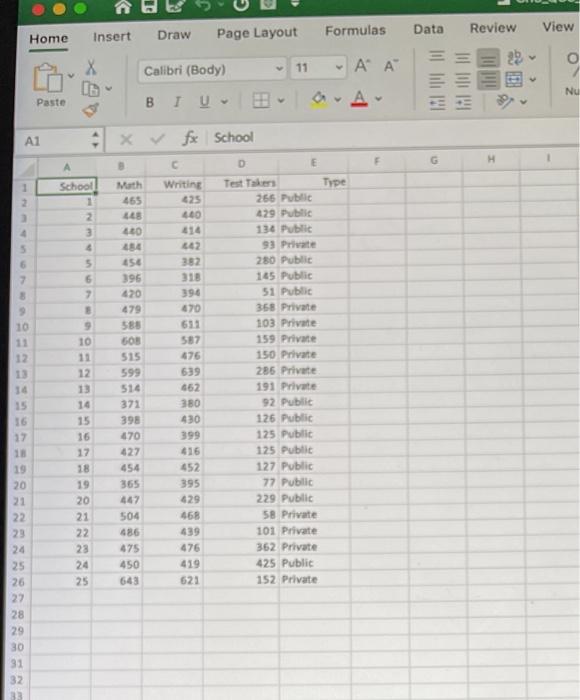
The accompanying table shows a portion of the average SAT math score (Math), the average SAT writing score (Writing), the number of testtakers (Test Toker), and whether the school is a private or public school (Type) for 25 high schools in a major metropolitan area, School Math Writing Test Taxers 465 425 266 Public 449 440 429 Public 25 621 152 Privato 1 2 DrictureClick here for the Excel Data File a-1. Construct a bubble plot that shows math score on the x-axis writing score on the y-axis, and number of test takers as the size of the bubble. Given the bubble plot, which statement best describes the relationship between math scores and writing scores? Math scores and writing scores have no relationship Math scores and writing scores have a positive tinear relationship O Math scores and writing scores have a negative linear relationship, O Moth scores and writing scores have a non-linear (U-shaped) relationship, a-2. Given the bubble plot, which statement best describes the relationship between math scores and the size of the school (the number of testtakers)? O Math scores and the size of the school have no apparent relationship Larger schools have higher test scores OSmaller schools have higher test scores. O Math scores and the size of the school have an inverted U-shaped relationship. b. Construct a scatterplot that shows math score on the x-axis and writing score on the y-axis. Use different colors or symbols to show whether the high school is a private or a public school. Which of the following statements best describes the relationship between math scores, writing scores, and type of school? Private schools tend to have higher math and writing scores Public schools tend to have higher math and writing scores. There is no relationship between type of school and test scores Both types of schools show a negative relationship between math and writing scores. Review Formulas Data View Insert Draw Home Page Layout o Calibri (Body) 11 A A Ill lili TIL 191 Nu Paste BIU A A1 x School E D G Type School 1 2 3 4 5 6 7 Math 465 LE 40 Writing 425 400 9 10 10 11 12 13 22 382 318 394 670 611 587 476 639 662 380 430 399 456 396 420 479 580 508 515 599 514 371 398 470 427 454 365 447 504 486 475 450 643 12 13 14 15 16 17 18 19 15 16 17 Test Takes 266 Public 429 Public 134 Public 93 Private 280 Public 165 Public 51 Public 368 Private 103 Private 159 Private 150 Private 286 Private 191 Private 92 Public 126 Public 125 Public 125 Public 127 Public 77 Public 229 Public 58 Private 101 Private 362 Private 425 Public 152 Private 20 19 20 21 22 23 24 25 26 27 28 29 30 31 32 33 21 22 23 24 25 452 395 429 468 439 476 419 621 The accompanying table shows a portion of the average SAT math score (Math), the average SAT writing score (Writing), the number of testtakers (Test Toker), and whether the school is a private or public school (Type) for 25 high schools in a major metropolitan area, School Math Writing Test Taxers 465 425 266 Public 449 440 429 Public 25 621 152 Privato 1 2 DrictureClick here for the Excel Data File a-1. Construct a bubble plot that shows math score on the x-axis writing score on the y-axis, and number of test takers as the size of the bubble. Given the bubble plot, which statement best describes the relationship between math scores and writing scores? Math scores and writing scores have no relationship Math scores and writing scores have a positive tinear relationship O Math scores and writing scores have a negative linear relationship, O Moth scores and writing scores have a non-linear (U-shaped) relationship, a-2. Given the bubble plot, which statement best describes the relationship between math scores and the size of the school (the number of testtakers)? O Math scores and the size of the school have no apparent relationship Larger schools have higher test scores OSmaller schools have higher test scores. O Math scores and the size of the school have an inverted U-shaped relationship. b. Construct a scatterplot that shows math score on the x-axis and writing score on the y-axis. Use different colors or symbols to show whether the high school is a private or a public school. Which of the following statements best describes the relationship between math scores, writing scores, and type of school? Private schools tend to have higher math and writing scores Public schools tend to have higher math and writing scores. There is no relationship between type of school and test scores Both types of schools show a negative relationship between math and writing scores. Review Formulas Data View Insert Draw Home Page Layout o Calibri (Body) 11 A A Ill lili TIL 191 Nu Paste BIU A A1 x School E D G Type School 1 2 3 4 5 6 7 Math 465 LE 40 Writing 425 400 9 10 10 11 12 13 22 382 318 394 670 611 587 476 639 662 380 430 399 456 396 420 479 580 508 515 599 514 371 398 470 427 454 365 447 504 486 475 450 643 12 13 14 15 16 17 18 19 15 16 17 Test Takes 266 Public 429 Public 134 Public 93 Private 280 Public 165 Public 51 Public 368 Private 103 Private 159 Private 150 Private 286 Private 191 Private 92 Public 126 Public 125 Public 125 Public 127 Public 77 Public 229 Public 58 Private 101 Private 362 Private 425 Public 152 Private 20 19 20 21 22 23 24 25 26 27 28 29 30 31 32 33 21 22 23 24 25 452 395 429 468 439 476 419 621