

Answered step by step
Verified Expert Solution
Question
1 Approved Answer
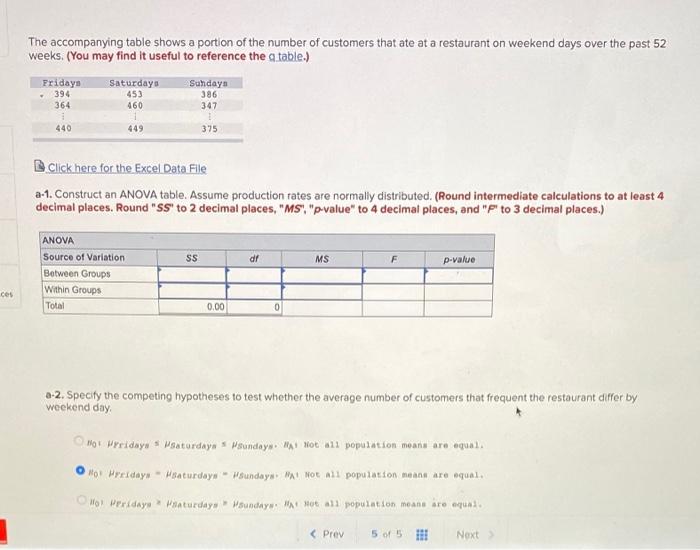
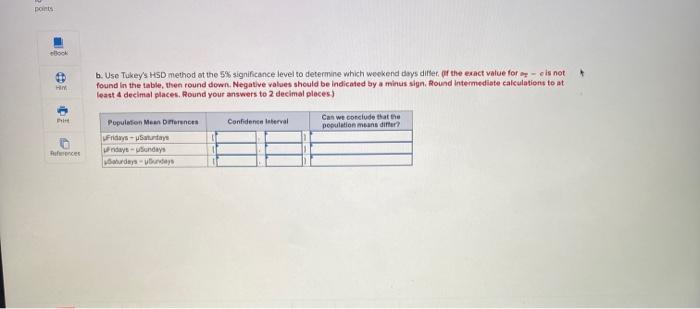
The accompanying table shows a portion of the number of customers that ate at a restaurant on weekend days over the past 52 weeks. (You
Step by Step Solution
There are 3 Steps involved in it
Step: 1

Get Instant Access to Expert-Tailored Solutions
See step-by-step solutions with expert insights and AI powered tools for academic success
Step: 2

Step: 3
Ace Your Homework with AI
Get the answers you need in no time with our AI-driven, step-by-step assistance
Get Started
Problems In State High School Finance
Authors: Julian Edward Butterworth
1st Edition
0554798298, 9780554798295