

Answered step by step
Verified Expert Solution
Question
1 Approved Answer
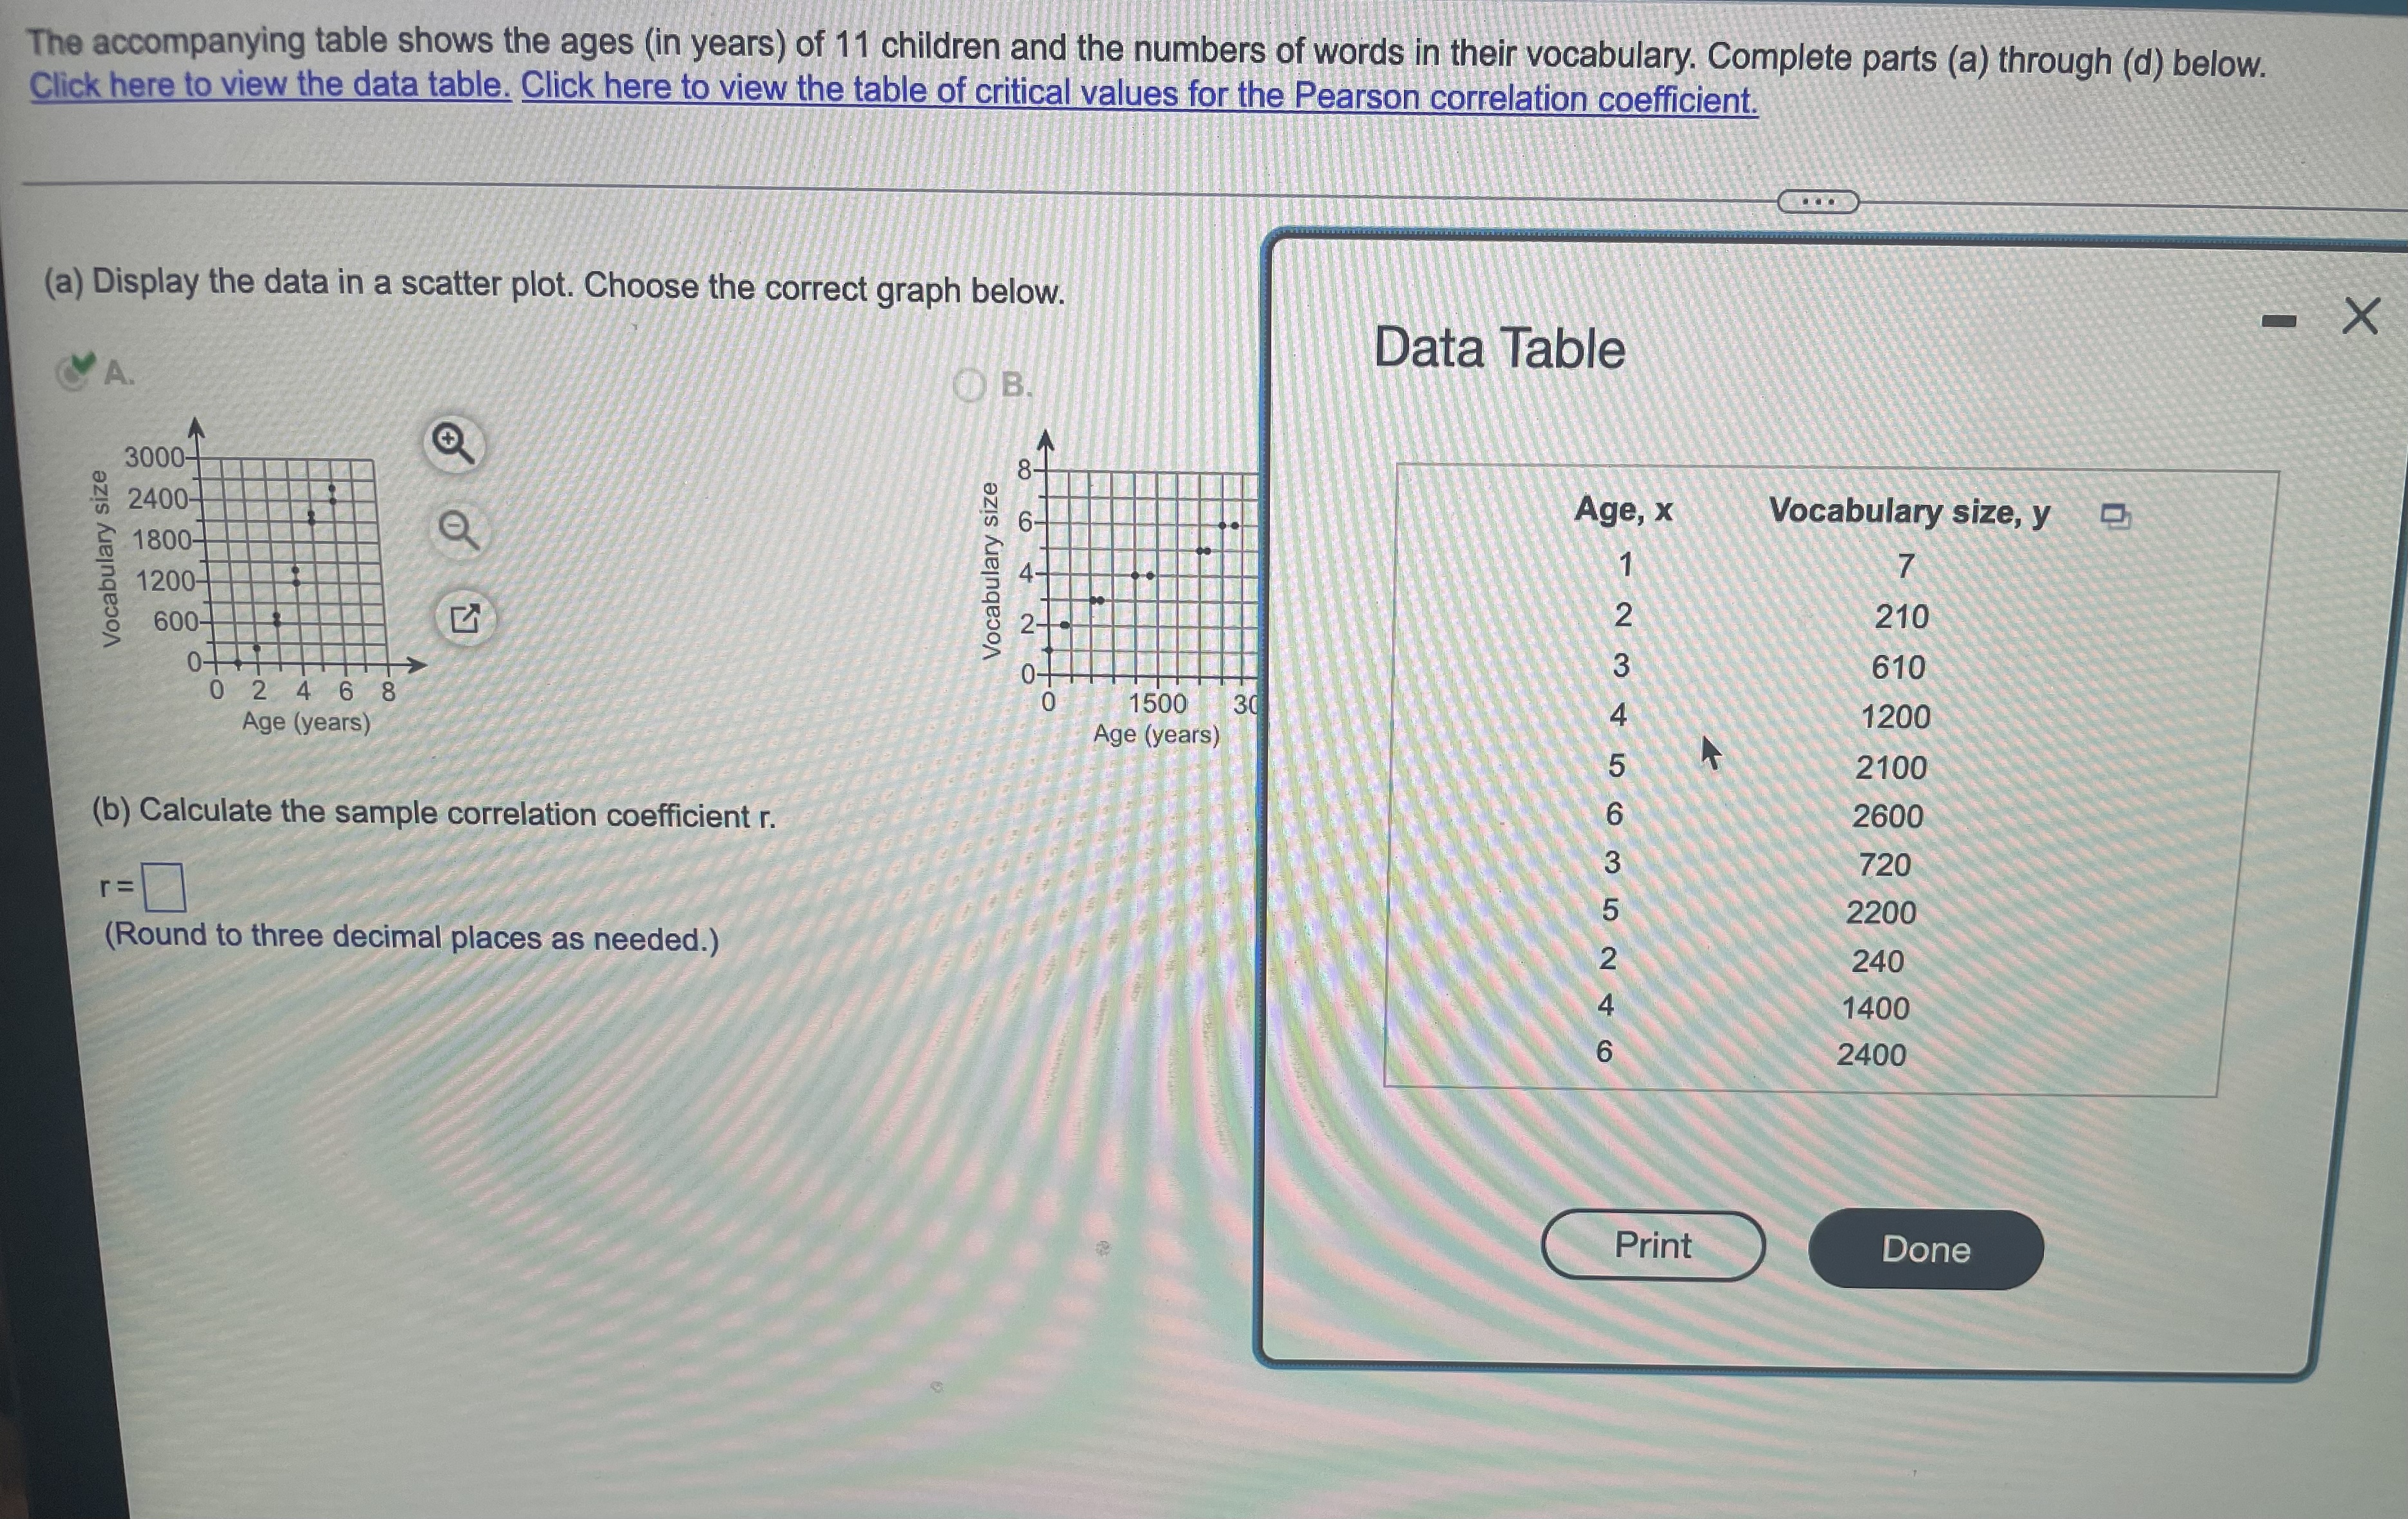
The accompanying table shows the ages (in years) of 11 children and the numbers of words in their vocabulary. Complete parts (a) through (d) below.
Step by Step Solution
There are 3 Steps involved in it
Step: 1

Get Instant Access to Expert-Tailored Solutions
See step-by-step solutions with expert insights and AI powered tools for academic success
Step: 2

Step: 3
Ace Your Homework with AI
Get the answers you need in no time with our AI-driven, step-by-step assistance
Get Started
Trigonometry
Authors: David M Kennedy, James Stewart, Lothar Redlin, Saleem Watson
2nd Edition
1285226089, 9781285226088