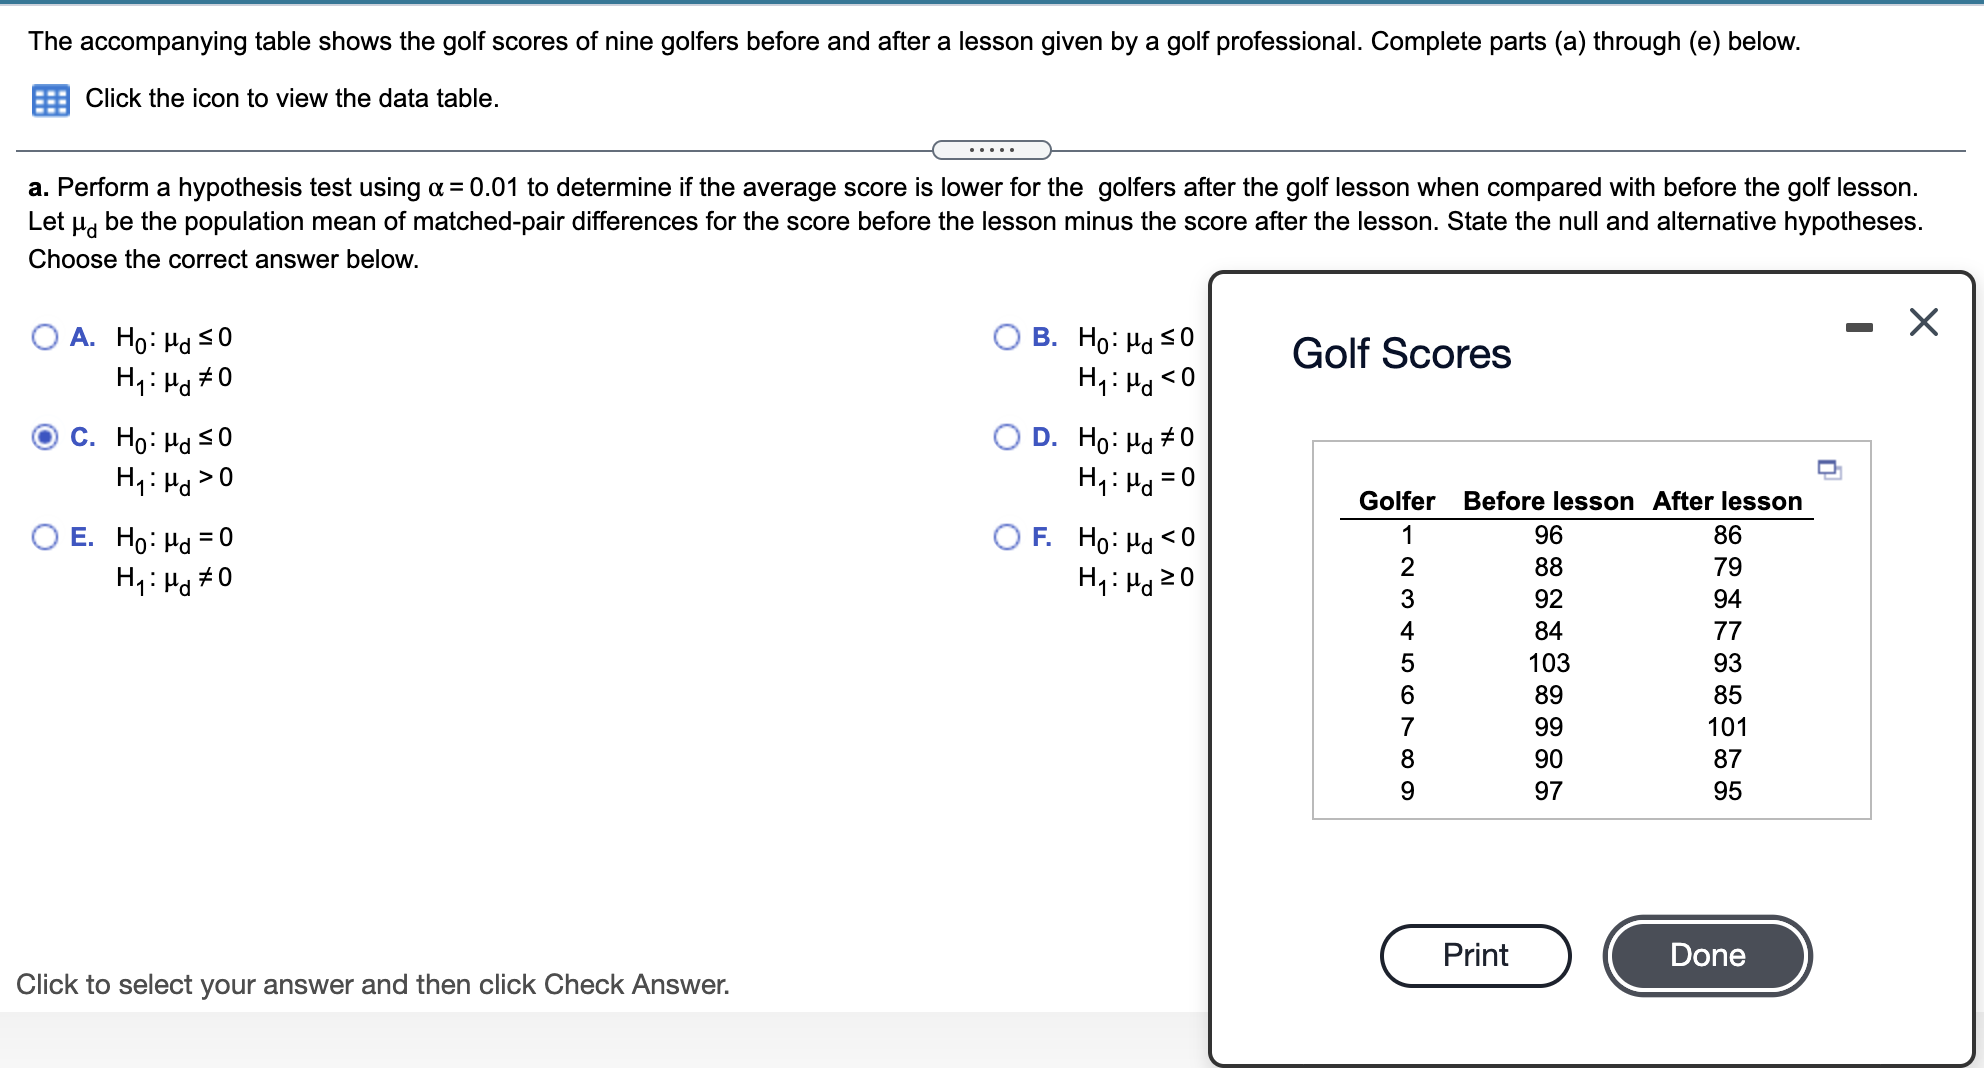
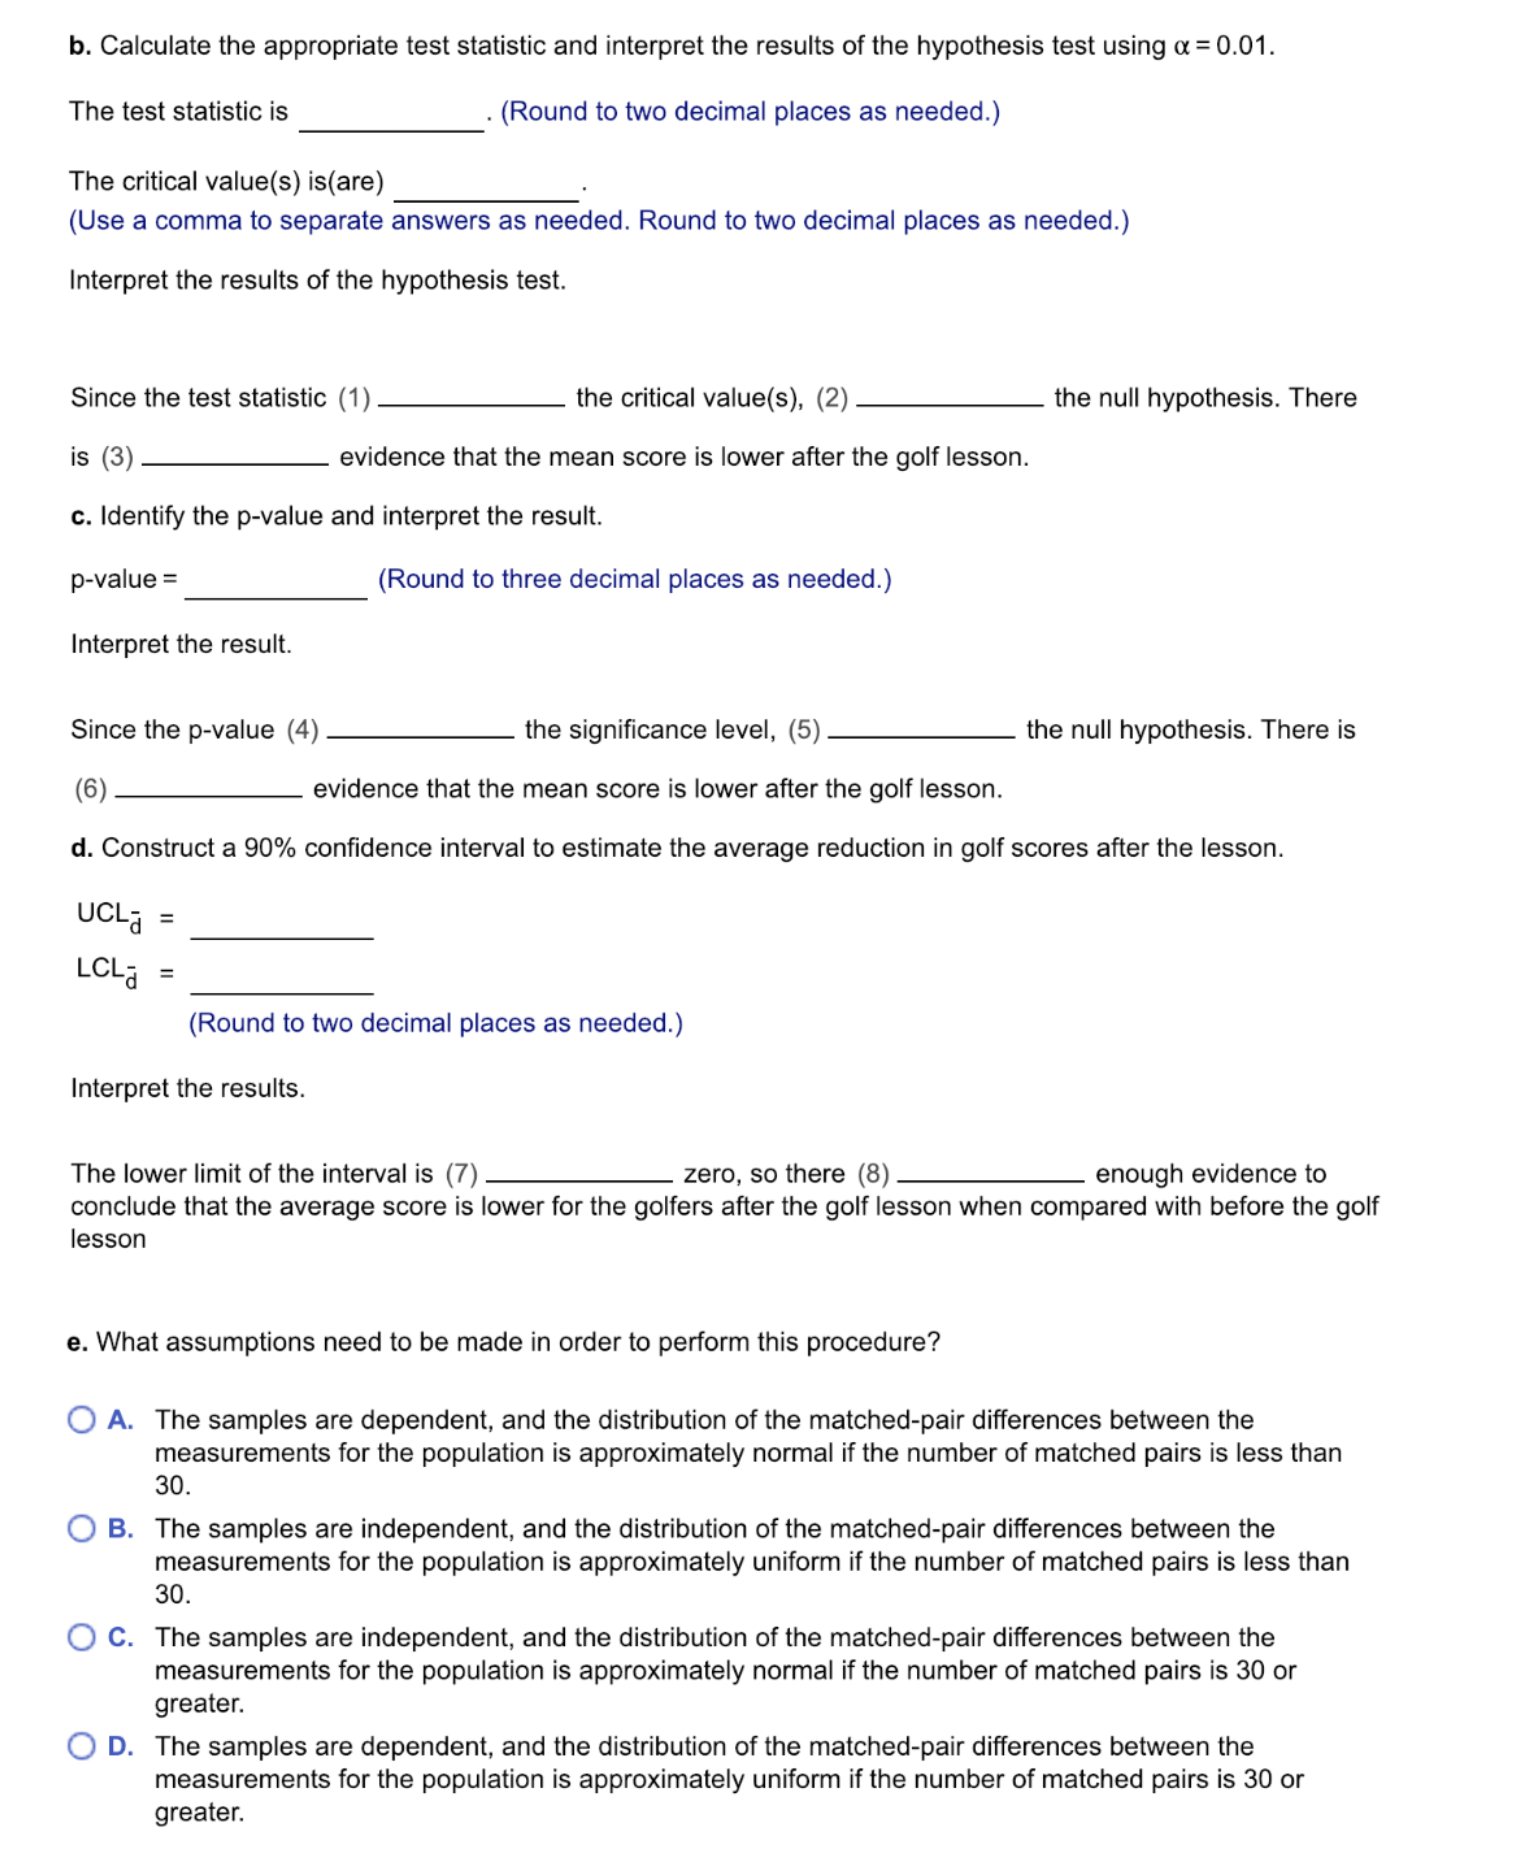
The accompanying table shows the golf scores of nine golfers before and after a lesson given by a golf professional. Complete parts (a) through (e) below. a Click the icon to view the data table. a. Perform a hypothesis test using 0: = 0.01 to determine if the average score is lower for the golfers after the golf lesson when compared with before the golf lesson. Let pd be the population mean of matched-pair differences for the score before the lesson minus the score after the lesson. State the null and alternative hypotheses. Choose the correct answer below. O A' :3 :2 :3 Golf Scores c H0: pd so H1: Pd > 0 . . Golfer Before lesson After lesson 0 E. Ho: Pd = . I 1 96 86 92 94 84 77 103 93 89 85 99 101 90 87 97 95 2 3 4 5 6 7 8 9 Click to select your answer and then click Check Answer. - b. Calculate the appropriate test statistic and interpret the results of the hypothesis test using a = 0.01. The test statistic is . (Round to two decimal places as needed.) The critical value(s) is(are) (Use a comma to separate answers as needed. Round to two decimal places as needed.) Interpret the results of the hypothesis test. Since the test statistic (1) the critical value(s), (2) the null hypothesis. There is (3) evidence that the mean score is lower after the golf lesson. 6. Identify the pvalue and interpret the result. p-value = (Round to three decimal places as needed.) Interpret the result. Since the p-value (4) the signicance level. (5) the null hypothesis. There is (6) evidence that the mean score is lower after the golf lesson. (I. Construct a 90% condence interval to estimate the average reduction in golf scores after the lesson. UCLa LCLa (Round to two decimal places as needed.) Interpret the results. The lower limit of the interval is (7) zero, so there (8) enough evidence to conclude that the average score is lower for the golfers after the golf lesson when compared with before the golf lesson e. What assumptions need to be made in order to perform this procedure? 0 A. The samples are dependent. and the distribution of the matched-pair differences between the measurements for the population is approximately normal if the number of matched pairs is less than 30. O B. The samples are independent. and the distribution of the matched-pair differences between the measurements for the population is approximately uniform if the number of matched pairs is less than 30. O C. The samples are independent. and the distribution of the matched-pair differences between the measurements for the population is approximately normal if the number of matched pairs is 30 or greater. 0 D. The samples are dependent. and the distribution of the matched-pair differences between the measurements for the population is approximately uniform if the number of matched pairs is 30 or greater