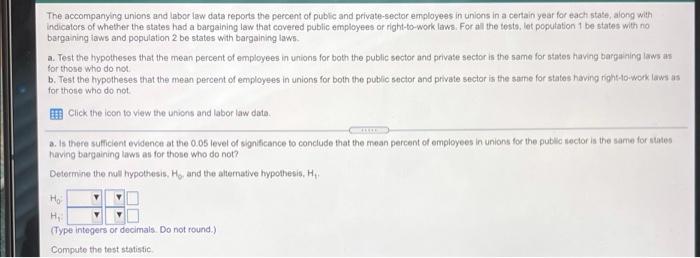
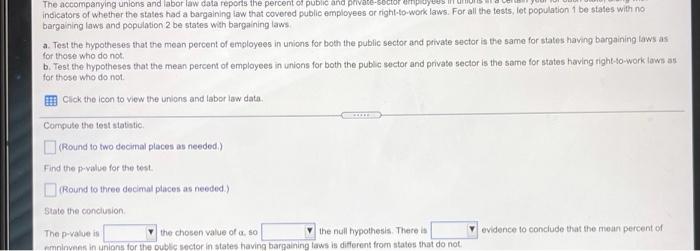
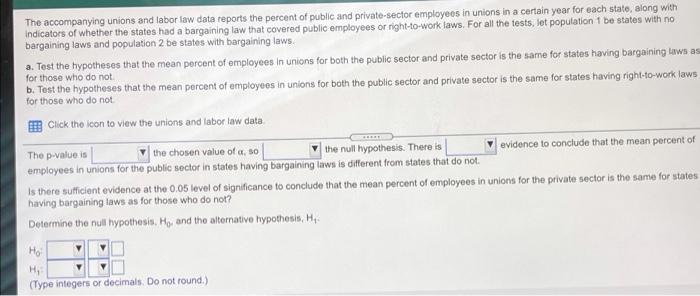
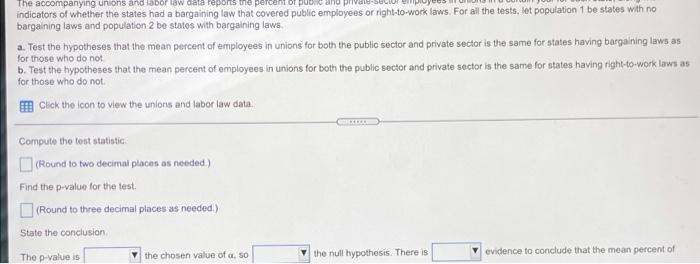
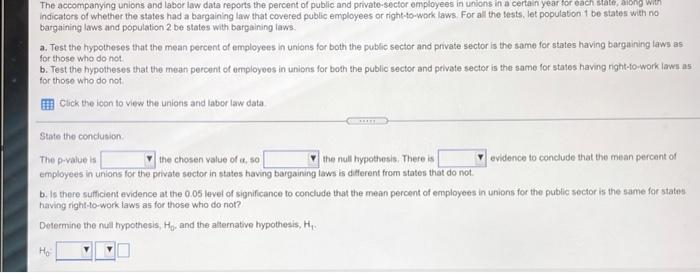
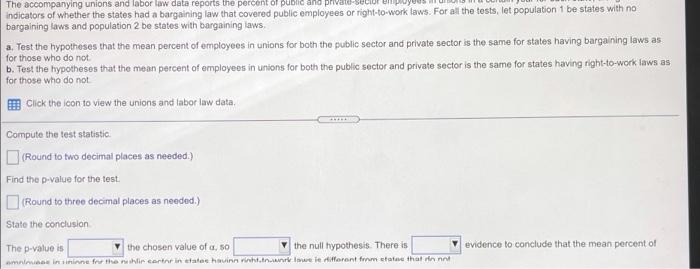
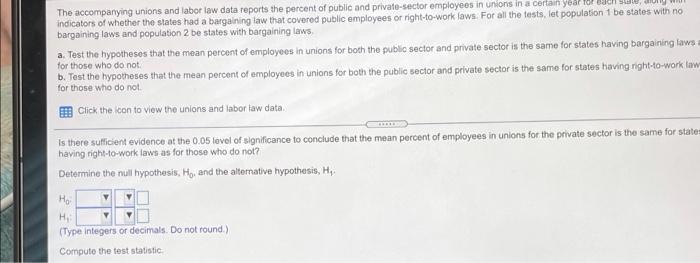
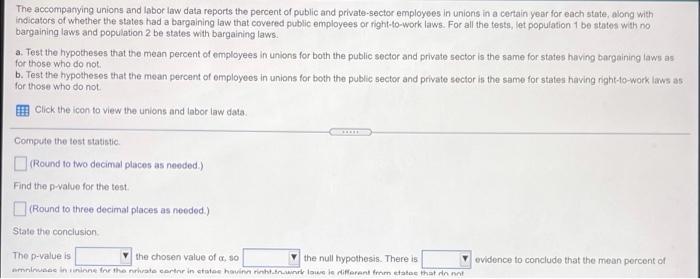
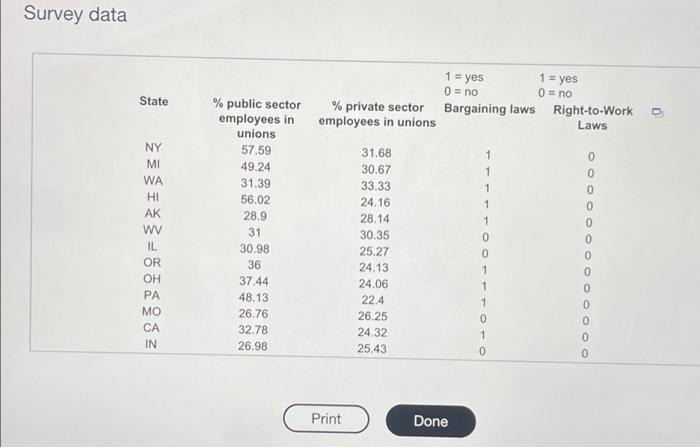
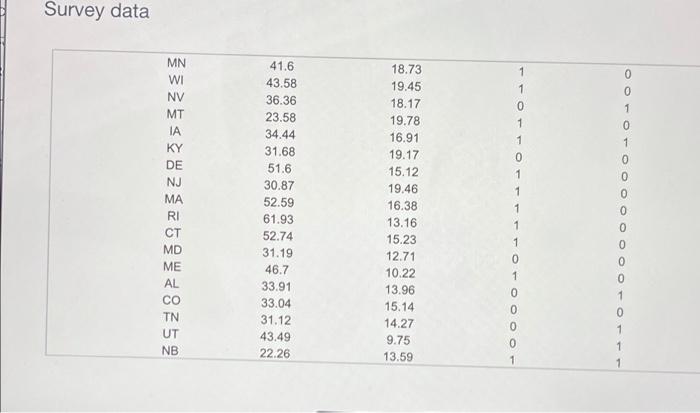
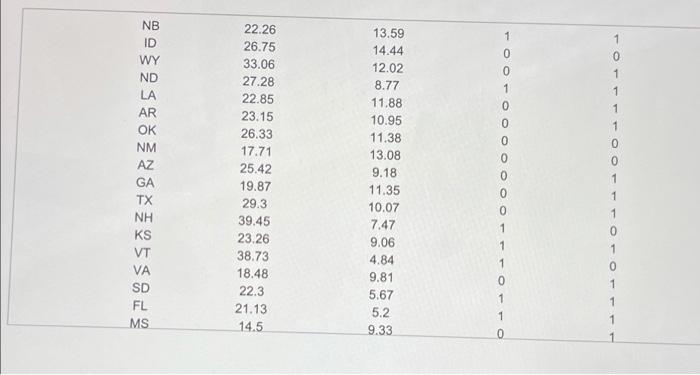
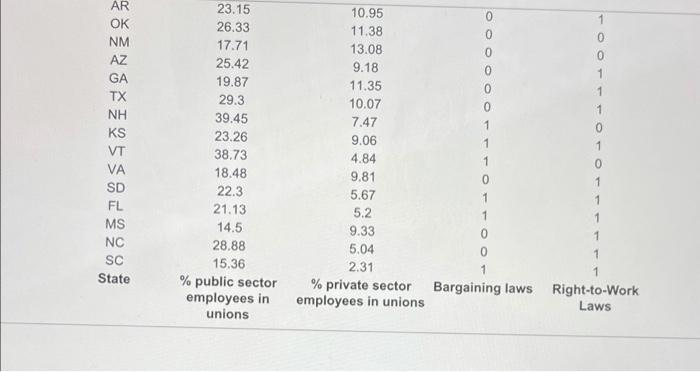
The accompanying unions and labor law data reports the percent of public and private sector employees in unions in a certain year for each state, along with indicators of whether the states had a bargaining law that covered public employees or right-to-work laws. For all the testo, lat population 1 be states with no bargaining laws and population 2 be states with bargaining taws. Test the hypotheses that the mean percent of employees in unions for both the public sector and private sector is the same for states having bargaining laws as for those who do not b. Test the hypotheses that the mean percent of employees in unions for both the public sector and private sector is the same for states having right-to-work laws as for those who do not Click the icon to view the unions and labor law date: a. Is there suficient evidence at the 0.05 level of significance to conclude that the moon percent of employees in unions for the public sector is the same for lates having bargaining was for those who do not? Determine the null hypothesis, H, and the alternative hypothesis, H. H H (Type integers or decimals. Do not round.) Compute the test statistic empot The accompanying unions and labor law data reports the percent of public and private indicators of whether the states had a bargaining taw that covered public employees or night-to-work laws. For all the tests, let population 1 be states with no bargaining laws and population 2 be states with bargaining laws a Test the hypotheses that the mean percent of employees in unions for both the public sector and private sector is the same for states having bargaining laws as for those who do not b. Test the hypotheses that the mean percent of employees in unions for both the public sector and private sector is the same for states having right-to-work low as for those who do not Click the icon to view the unions and labor law data, Compute the test statistic (Round to two decimal places as needed) Find the powalue for the test Round to three decimal places as needed State the conclusion The p-value is the chosen value of so the null hypothesis. There is aminees in unions for the public sector in states having bargaining laws is different from states that do not evidence to conclude that the moun percent of The accompanying unions and labor law data reports the percent of public and private sector employees in unions in a certain year for each state, along with Indicators of whether the states had a bargaining law that covered public employees or right-to-work laws. For all the fests, let population 1 be states with no bargaining laws and population 2 be states with bargaining laws. a. Test the hypotheses that the mean percent of employees in unions for both the public sector and private sector is the same for states having bargaining laws as for those who do not. b. Test the hypotheses that the mean percent of employees in unions for both the public sector and private sector is the same for states having right-to-work laws for those who do not Click the icon to view the unions and labor law data The p-value is the chosen value of a 80 the null hypothesis. There is evidence to conclude that the mean percent of employees in unions for the public sector in states having bargaining lawe is different from states that do not. Is there sufficient evidence at the 0.05 level of significance to conclude that the mean percent of employees in unions for the private sector is the same for states having bargaining laws as for those who do not? Determine the null hypothesis. Ho, and the alternative hypothesis, Hi (Type integers or decimals. Do not round.) The accompanying unions and labor law data reports or po indicators of whether the states had a bargaining law that covered public employees or right-to-work laws. For all the tests, let population 1 be states with no bargaining laws and population 2 be states with bargaining laws a. Tost the hypotheses that the mean percent of employees in unions for both the public sector and private sector is the same for states having bargaining laws as for those who do not b. Test the hypotheses that the mean percent of employees in unions for both the public sector and private sector is the same for states having right-to-work laws as for those who do not Click the icon to view the unions and labor law data, Compute the test statistic (Round to two decimal places as needed) Find the p-value for the test (Round to three decimal places as noeded) State the conclusion The p-value is the chosen value of a so the null hypothesis. There is evidence to conclude that the mean percent of The accompanying unions and labor law data reports the percent of public and private sector employees in unions in a certain year for each stalo, Song With Indicators of whether the states had a bargaining law that covered public employees or right-to-work laws. For all the tests. let population 1 De states with no bargaining laws and population 2 be states with bargaining laws. a. Test the hypotheses that the mean percent of employees in unions for both the public sector and private sector is the same for states having bargaining taws as for those who do not b. Test the hypotheses that the mean percent of employoos in unions for both the public sector and private sector is the same for states having right-to-work lown as for those who do not Click the icon to view the unions and labor law data State the conclusion The p-value is the chosen value of 1,50 the null hypothesis. There is evidence to conclude that the mean percent of employees in unions for the private sector in states having bargaining laws is different from states that do not b. Is there sufficient evidence at the 0.05 level of significance to conclude that the mean percent of employees in unions for the public sector is the same for states having right-to-work laws as for those who do not? Determine the null hypothesis, Ho, and the alternative hypothesis, H Ho The accompanying unions and labor law data reports the percent of public and private seci indicators of whether the states had a bargaining law that covered public employees or right-to-work laws. For all the tests, let population 1 be states with no bargaining laws and population 2 be states with bargaining laws. a. Test the hypotheses that the mean percent of employees in unions for both the public sector and private sector is the same for states having bargaining laws as for those who do not b. Test the hypotheses that the mean percent of employees in unions for both the public sector and private sector is the same for states having right-to-work laws as for those who do not Click the icon to view the unions and labor law data, Compute the test statistic (Round to two decimal places as needed.) Find the p-value for the test. (Round to three decimal places as needed.) State the conclusion The p-value is the chosen value of a so the null hypothesis. There is mein sinne fr their carta in states hunn hinne le torent from state that not evidence to conclude that the mean percento! The accompanying unions and labor law data reports the percent of public and private sector employees in unions in a certain year 10 indicators of whether the states had a bargaining law that covered public employees or right-to-work laws. For all the tests, let population 1 be states with no bargaining laws and population 2 be states with bargaining laws a. Test the hypotheses that the mean percent of employees in unions for both the public sector and private sector in the same for states having bargaining laws for those who do not b. Test the hypotheses that the mean percent of employees in unions for both the public sector and private sector is the same for states having right-to-work law for those who do not Click the con to view the unions and labor law data Is there sufficient evidence at the 0.05 level of significance to conclude that the mean percent of employees in unions for the private sector is the same for state having right-to-work laws as for those who do not? Determine the nuill hypothesis, Ho, and the alternative hypothesis, H Ho H (Type Integers or decimals. Do not round) Computo the test statistic The accompanying unions and labor law data reports the percent of public and private sector employees in unions in a certain your for each state, along with indicators of whether the states had a bargaining law that covered public employees or right-to-work laws. For all the tests, tot population 1 be states with no bargaining laws and population 2 be states with bargaining laws. a. Test the hypotheses that the mean percent of employees in unions for both the public sector and private sector is the same for states having bargaining laws as for those who do not b. Test the hypotheses that the mean percent of omployees in unions for both the public sector and private sector is the same for states having right-to-work laws as for those who do not Click the icon to view the unions and tabor law data Compute the tost statistic (Round to two decimal places as needed) Find the p-value for the test (Round to three decimal places as needed.) State the conclusion The p-value is the chosen value of so the null hypothesis. There is minninne in the nata cartnr in te hou. V low different from tee that it evidence to conclude that the mean percent of Survey data State 1 = yes 1 = yes 0 = no 0 = no Bargaining laws Right-to-Work Laws % private sector employees in unions NY MI WA HI AK WV IL OR OH % public sector employees in unions 57.59 49.24 31.39 56.02 28.9 31 30.98 36 37.44 48.13 26.76 32.78 26.98 31.68 30.67 33.33 24.16 28.14 30.35 25.27 24.13 24.06 22.4 26.25 24.32 25.43 1 1 1 1 0 0 1 1 1 0 1 0 PA MO CA IN Print Done Survey data 0 MN WI NV MT IA KY DE NJ MA RI CT MD ME AL CO TN UT NB 41.6 43.58 36.36 23.58 34.44 31.68 51.6 30.87 52.59 61.93 52.74 31.19 46.7 33.91 33.04 31.12 43.49 22.26 Mmwwm 18.73 19.45 18.17 19.78 16.91 19.17 15.12 19.46 16.38 13.16 15.23 12.71 10.22 13.96 15.14 14.27 9.75 13.59 1 1 0 1 1 0 1 1 1 1 0 1 0 1 0 0 0 0 0 0 0 0 1 0 1 1 1 0 1 0 0 0 0 1 0 AR OK NM AZ GA 0 0 0 0 0 TX 1 23.15 26.33 17.71 25.42 19.87 29.3 39.45 23.26 38.73 18.48 22.3 21.13 14.5 28.88 15.36 % public sector employees in unions 0 0 1 1 1 0 1 0 NH KS VT VA 10.95 11.38 13.08 9.18 11.35 10.07 7.47 9.06 4.84 9.81 5.67 5.2 9.33 5.04 2.31 % private sector employees in unions 1 1 0 1 SD 1 1 FL MS NC SC State 1 1 0 0 1 Bargaining laws Right-to-Work Laws The accompanying unions and labor law data reports the percent of public and private sector employees in unions in a certain year for each state, along with indicators of whether the states had a bargaining law that covered public employees or right-to-work laws. For all the testo, lat population 1 be states with no bargaining laws and population 2 be states with bargaining taws. Test the hypotheses that the mean percent of employees in unions for both the public sector and private sector is the same for states having bargaining laws as for those who do not b. Test the hypotheses that the mean percent of employees in unions for both the public sector and private sector is the same for states having right-to-work laws as for those who do not Click the icon to view the unions and labor law date: a. Is there suficient evidence at the 0.05 level of significance to conclude that the moon percent of employees in unions for the public sector is the same for lates having bargaining was for those who do not? Determine the null hypothesis, H, and the alternative hypothesis, H. H H (Type integers or decimals. Do not round.) Compute the test statistic empot The accompanying unions and labor law data reports the percent of public and private indicators of whether the states had a bargaining taw that covered public employees or night-to-work laws. For all the tests, let population 1 be states with no bargaining laws and population 2 be states with bargaining laws a Test the hypotheses that the mean percent of employees in unions for both the public sector and private sector is the same for states having bargaining laws as for those who do not b. Test the hypotheses that the mean percent of employees in unions for both the public sector and private sector is the same for states having right-to-work low as for those who do not Click the icon to view the unions and labor law data, Compute the test statistic (Round to two decimal places as needed) Find the powalue for the test Round to three decimal places as needed State the conclusion The p-value is the chosen value of so the null hypothesis. There is aminees in unions for the public sector in states having bargaining laws is different from states that do not evidence to conclude that the moun percent of The accompanying unions and labor law data reports the percent of public and private sector employees in unions in a certain year for each state, along with Indicators of whether the states had a bargaining law that covered public employees or right-to-work laws. For all the fests, let population 1 be states with no bargaining laws and population 2 be states with bargaining laws. a. Test the hypotheses that the mean percent of employees in unions for both the public sector and private sector is the same for states having bargaining laws as for those who do not. b. Test the hypotheses that the mean percent of employees in unions for both the public sector and private sector is the same for states having right-to-work laws for those who do not Click the icon to view the unions and labor law data The p-value is the chosen value of a 80 the null hypothesis. There is evidence to conclude that the mean percent of employees in unions for the public sector in states having bargaining lawe is different from states that do not. Is there sufficient evidence at the 0.05 level of significance to conclude that the mean percent of employees in unions for the private sector is the same for states having bargaining laws as for those who do not? Determine the null hypothesis. Ho, and the alternative hypothesis, Hi (Type integers or decimals. Do not round.) The accompanying unions and labor law data reports or po indicators of whether the states had a bargaining law that covered public employees or right-to-work laws. For all the tests, let population 1 be states with no bargaining laws and population 2 be states with bargaining laws a. Tost the hypotheses that the mean percent of employees in unions for both the public sector and private sector is the same for states having bargaining laws as for those who do not b. Test the hypotheses that the mean percent of employees in unions for both the public sector and private sector is the same for states having right-to-work laws as for those who do not Click the icon to view the unions and labor law data, Compute the test statistic (Round to two decimal places as needed) Find the p-value for the test (Round to three decimal places as noeded) State the conclusion The p-value is the chosen value of a so the null hypothesis. There is evidence to conclude that the mean percent of The accompanying unions and labor law data reports the percent of public and private sector employees in unions in a certain year for each stalo, Song With Indicators of whether the states had a bargaining law that covered public employees or right-to-work laws. For all the tests. let population 1 De states with no bargaining laws and population 2 be states with bargaining laws. a. Test the hypotheses that the mean percent of employees in unions for both the public sector and private sector is the same for states having bargaining taws as for those who do not b. Test the hypotheses that the mean percent of employoos in unions for both the public sector and private sector is the same for states having right-to-work lown as for those who do not Click the icon to view the unions and labor law data State the conclusion The p-value is the chosen value of 1,50 the null hypothesis. There is evidence to conclude that the mean percent of employees in unions for the private sector in states having bargaining laws is different from states that do not b. Is there sufficient evidence at the 0.05 level of significance to conclude that the mean percent of employees in unions for the public sector is the same for states having right-to-work laws as for those who do not? Determine the null hypothesis, Ho, and the alternative hypothesis, H Ho The accompanying unions and labor law data reports the percent of public and private seci indicators of whether the states had a bargaining law that covered public employees or right-to-work laws. For all the tests, let population 1 be states with no bargaining laws and population 2 be states with bargaining laws. a. Test the hypotheses that the mean percent of employees in unions for both the public sector and private sector is the same for states having bargaining laws as for those who do not b. Test the hypotheses that the mean percent of employees in unions for both the public sector and private sector is the same for states having right-to-work laws as for those who do not Click the icon to view the unions and labor law data, Compute the test statistic (Round to two decimal places as needed.) Find the p-value for the test. (Round to three decimal places as needed.) State the conclusion The p-value is the chosen value of a so the null hypothesis. There is mein sinne fr their carta in states hunn hinne le torent from state that not evidence to conclude that the mean percento! The accompanying unions and labor law data reports the percent of public and private sector employees in unions in a certain year 10 indicators of whether the states had a bargaining law that covered public employees or right-to-work laws. For all the tests, let population 1 be states with no bargaining laws and population 2 be states with bargaining laws a. Test the hypotheses that the mean percent of employees in unions for both the public sector and private sector in the same for states having bargaining laws for those who do not b. Test the hypotheses that the mean percent of employees in unions for both the public sector and private sector is the same for states having right-to-work law for those who do not Click the con to view the unions and labor law data Is there sufficient evidence at the 0.05 level of significance to conclude that the mean percent of employees in unions for the private sector is the same for state having right-to-work laws as for those who do not? Determine the nuill hypothesis, Ho, and the alternative hypothesis, H Ho H (Type Integers or decimals. Do not round) Computo the test statistic The accompanying unions and labor law data reports the percent of public and private sector employees in unions in a certain your for each state, along with indicators of whether the states had a bargaining law that covered public employees or right-to-work laws. For all the tests, tot population 1 be states with no bargaining laws and population 2 be states with bargaining laws. a. Test the hypotheses that the mean percent of employees in unions for both the public sector and private sector is the same for states having bargaining laws as for those who do not b. Test the hypotheses that the mean percent of omployees in unions for both the public sector and private sector is the same for states having right-to-work laws as for those who do not Click the icon to view the unions and tabor law data Compute the tost statistic (Round to two decimal places as needed) Find the p-value for the test (Round to three decimal places as needed.) State the conclusion The p-value is the chosen value of so the null hypothesis. There is minninne in the nata cartnr in te hou. V low different from tee that it evidence to conclude that the mean percent of Survey data State 1 = yes 1 = yes 0 = no 0 = no Bargaining laws Right-to-Work Laws % private sector employees in unions NY MI WA HI AK WV IL OR OH % public sector employees in unions 57.59 49.24 31.39 56.02 28.9 31 30.98 36 37.44 48.13 26.76 32.78 26.98 31.68 30.67 33.33 24.16 28.14 30.35 25.27 24.13 24.06 22.4 26.25 24.32 25.43 1 1 1 1 0 0 1 1 1 0 1 0 PA MO CA IN Print Done Survey data 0 MN WI NV MT IA KY DE NJ MA RI CT MD ME AL CO TN UT NB 41.6 43.58 36.36 23.58 34.44 31.68 51.6 30.87 52.59 61.93 52.74 31.19 46.7 33.91 33.04 31.12 43.49 22.26 Mmwwm 18.73 19.45 18.17 19.78 16.91 19.17 15.12 19.46 16.38 13.16 15.23 12.71 10.22 13.96 15.14 14.27 9.75 13.59 1 1 0 1 1 0 1 1 1 1 0 1 0 1 0 0 0 0 0 0 0 0 1 0 1 1 1 0 1 0 0 0 0 1 0 AR OK NM AZ GA 0 0 0 0 0 TX 1 23.15 26.33 17.71 25.42 19.87 29.3 39.45 23.26 38.73 18.48 22.3 21.13 14.5 28.88 15.36 % public sector employees in unions 0 0 1 1 1 0 1 0 NH KS VT VA 10.95 11.38 13.08 9.18 11.35 10.07 7.47 9.06 4.84 9.81 5.67 5.2 9.33 5.04 2.31 % private sector employees in unions 1 1 0 1 SD 1 1 FL MS NC SC State 1 1 0 0 1 Bargaining laws Right-to-Work Laws
