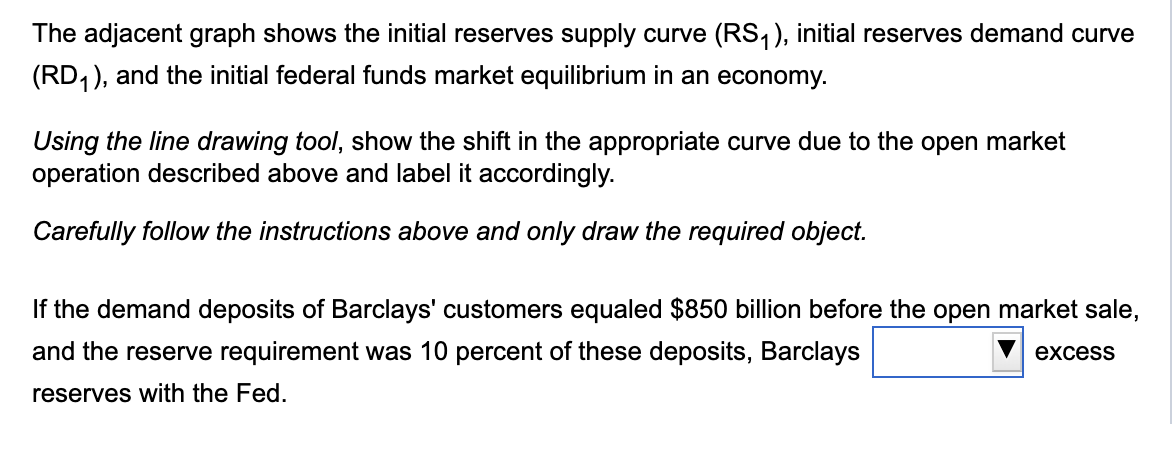
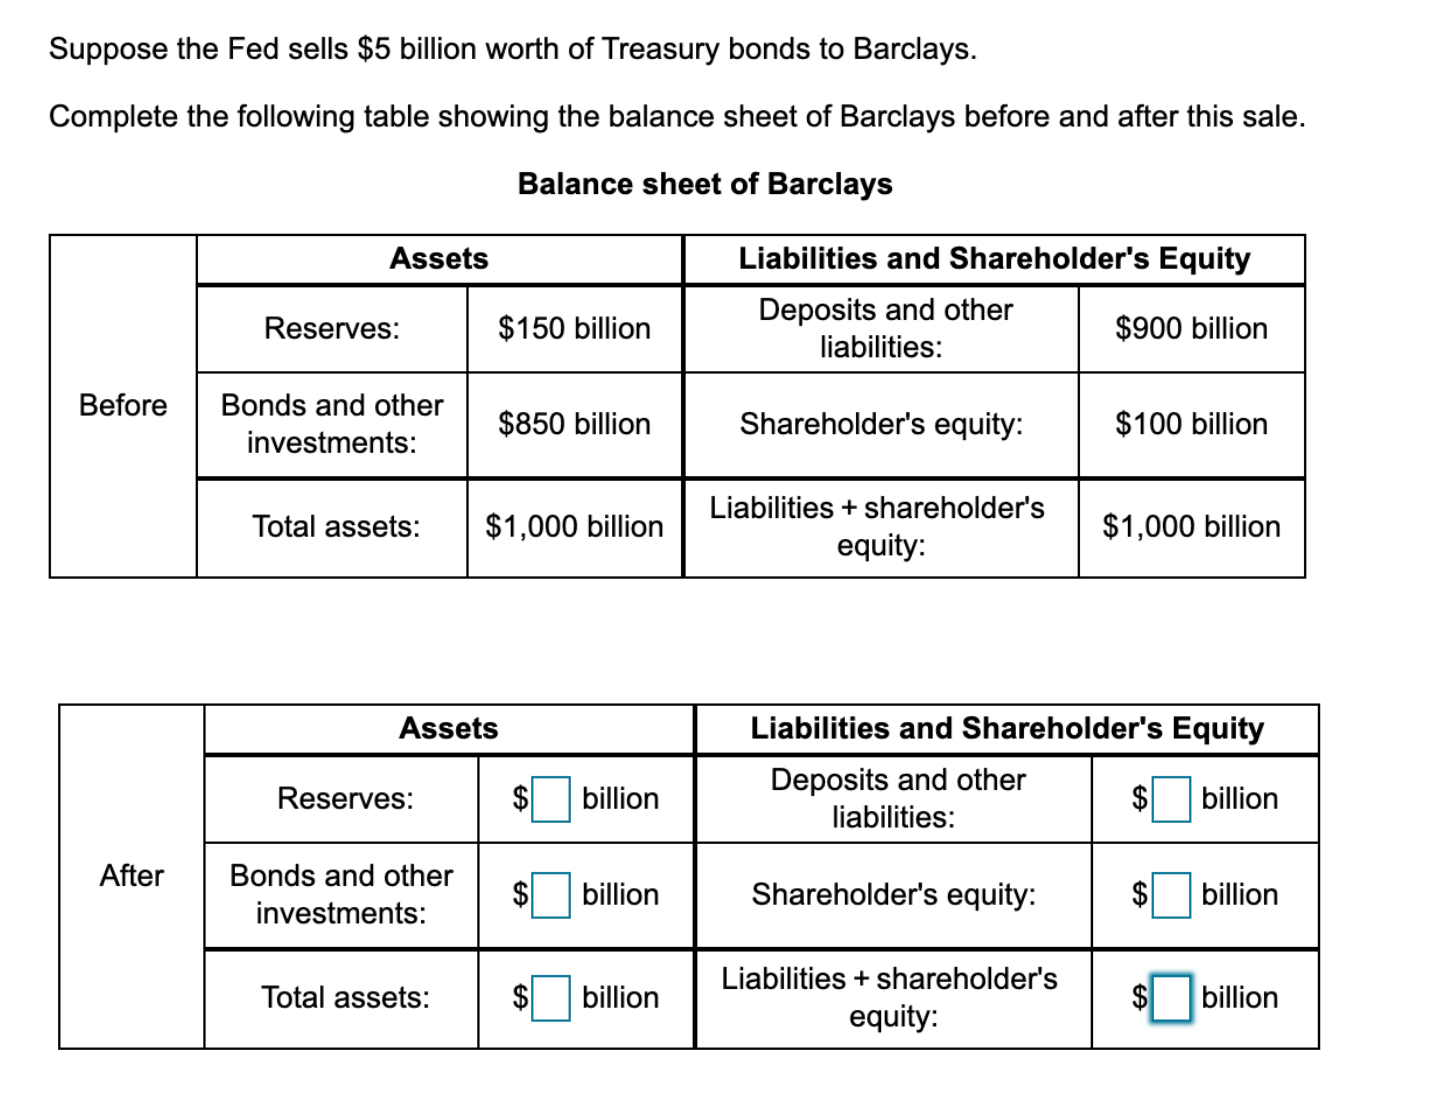
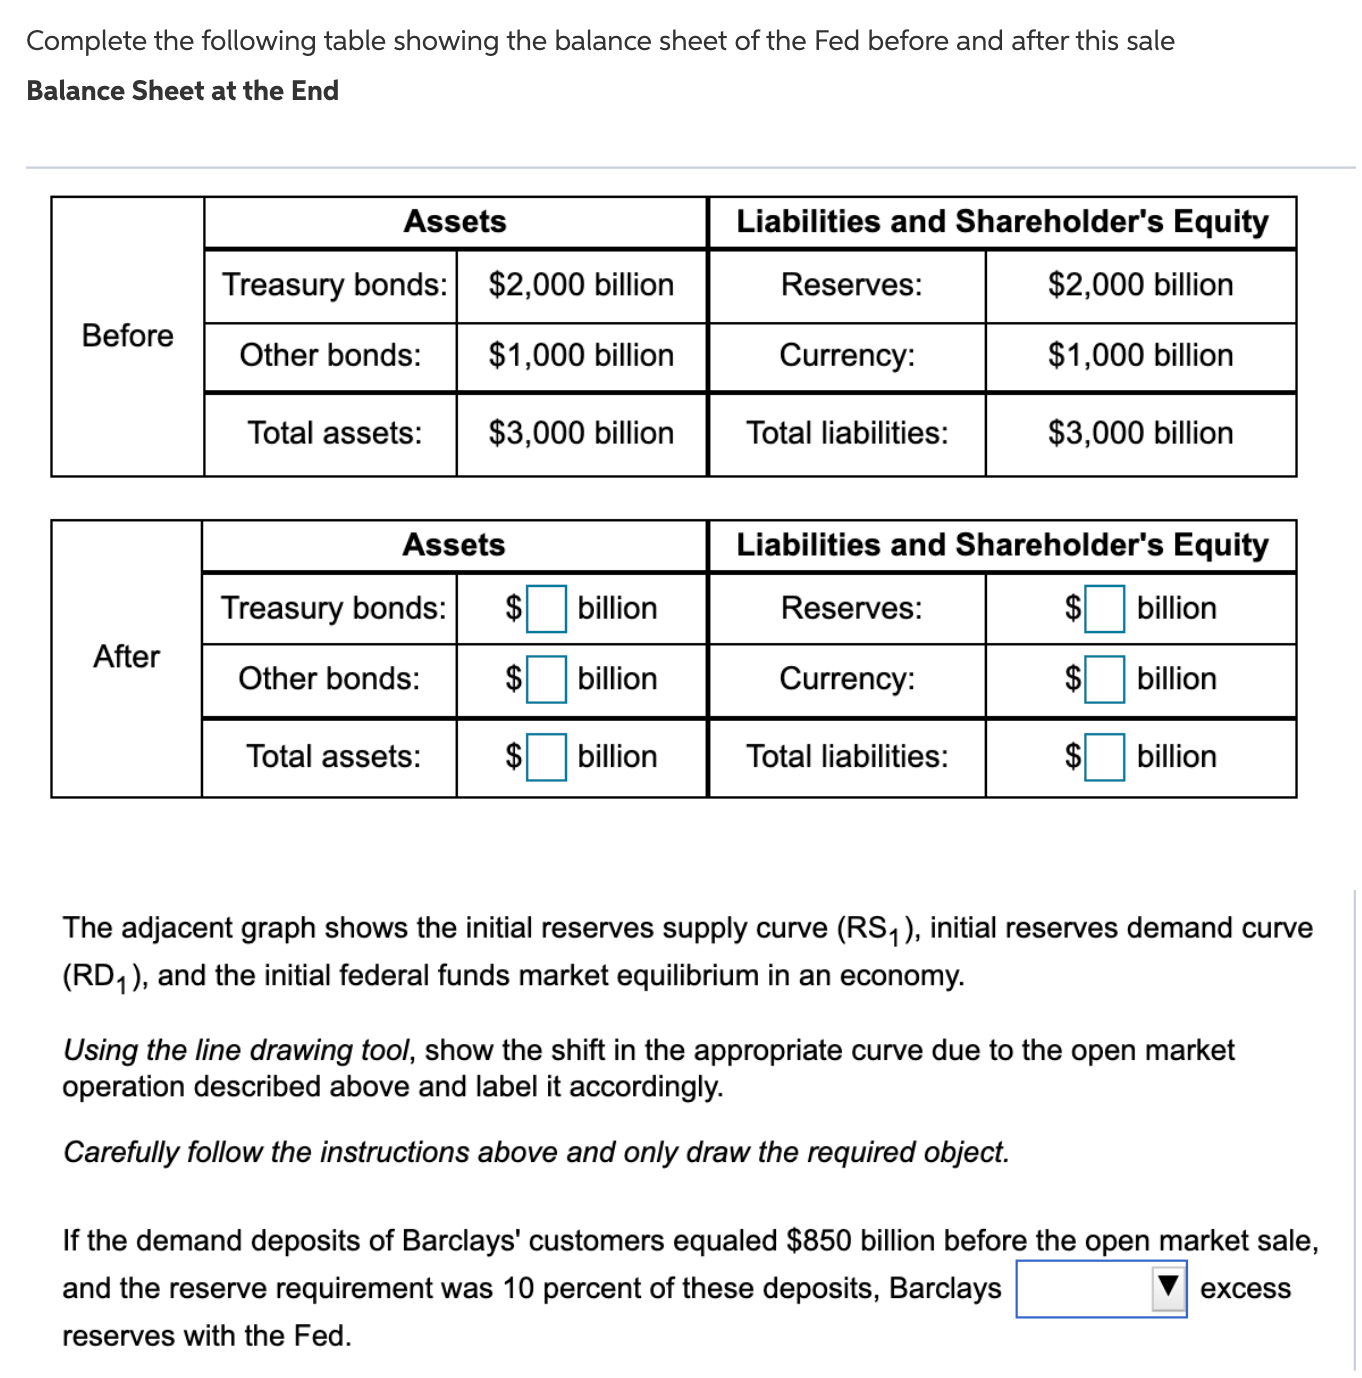
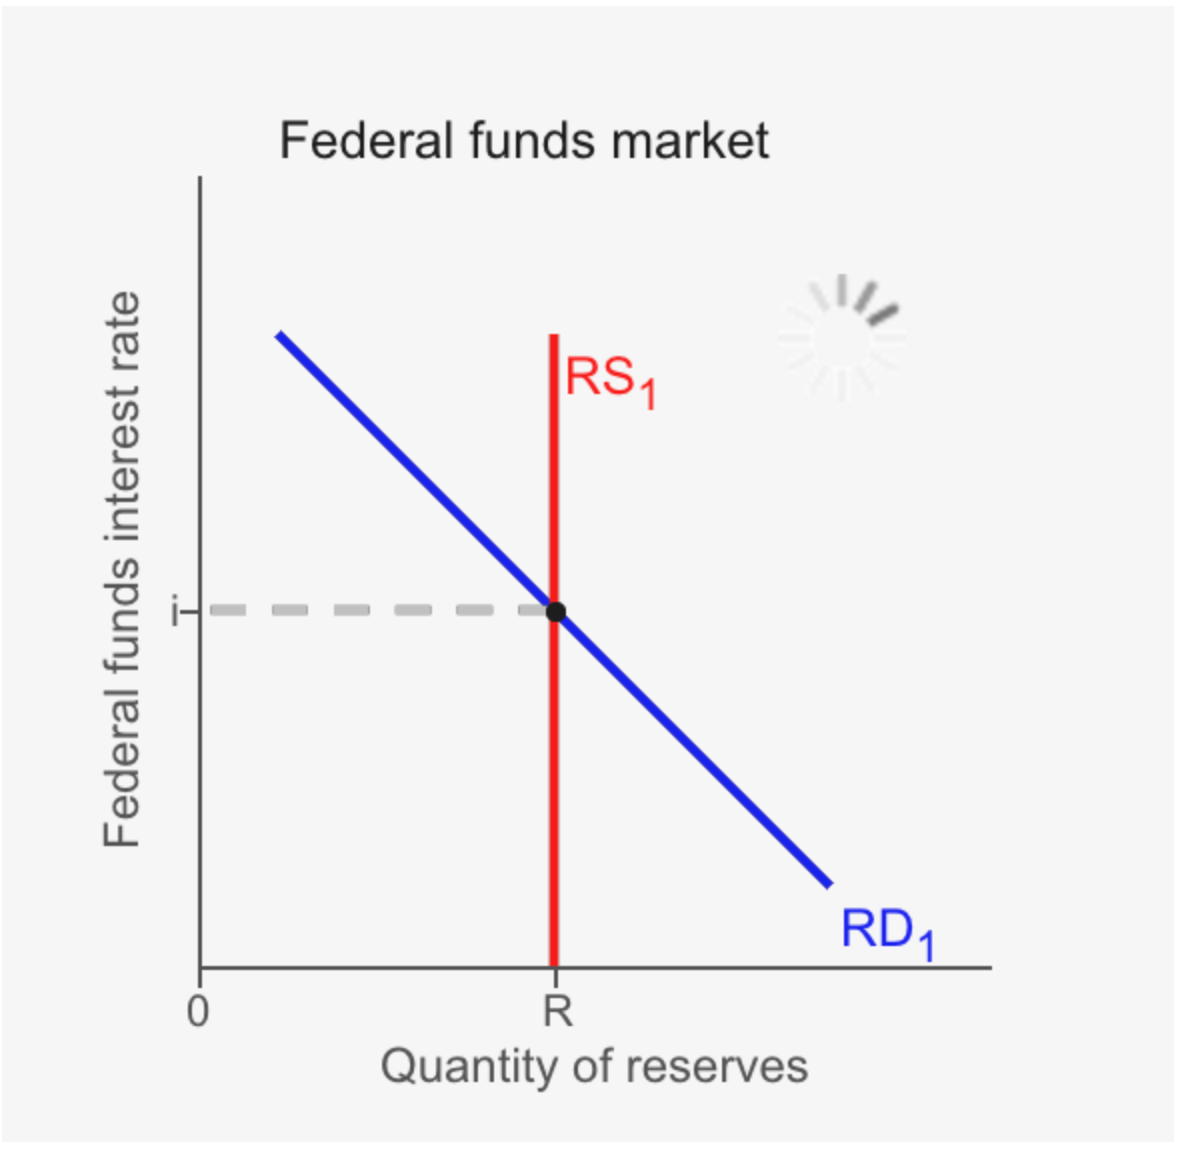
The adjacent graph shows the initial reserves supply curve (RS1), initial reserves demand curve (RD1)a and the initial federal funds market equilibrium in an economy. Using the line drawing tool, show the shift in the appropriate curve due to the open market operation described above and label it accordingly. Carefully follow the instructions above and only draw the required object. If the demand deposits of Barclays' customers equaled $850 billion before the open market sale, and the reserve requirement was 10 percent of these deposits, Barclays |:| excess reserves with the Fed. Suppose the Fed sells $5 billion worth of Treasury bonds to Barclays. Complete the following table showing the balance sheet of Barclays before and after this sale. Balance sheet of Barclays Assets Liabilities and Shareholder's Equity Reserves: $150 billion Deposits and other liabilities: $900 billion Before Bonds and other investments: $850 billion Shareholder's equity: $100 billion Total assets: $1,000 billion Liabilities + shareholder's equity: $1,000 billion Assets Liabilities and Shareholder's Equity Reserves: $ billion Deposits and other liabilities: billion After Bonds and other investments: $ billion Shareholder's equity: EA billion Total assets: $ billion Liabilities + shareholder's equity: $ billionComplete the following table showing the balance sheet of the Fed before and after this sale Balance Sheet at the End Liabilities and Shareholder's Equity Treasury bonds: $2.000 billion $2.000 billion Befre Otherbonds: $1.000 billion $1,000 billion Total assets: $3.000 billion Total liabilities: $3,000 billion Liabilities and Shareholder's Equity Treasury bonds: $D billion $|:| billion After Other bonds: 5D billion $|:| billion Total assets: $D billion Total liabilities: $|:| billion The adjacent graph shows the initial reserves supply curve (RS1), initial reserves demand curve (RD1). and the initial federal funds market equilibrium in an economy. Using the line drawing tool, show the shift in the appropriate curve due to the open market operation described above and label it accordingly. Carefully follow the instructions above and only draw the required object. If the demand deposits of Barclays' customers equaled $850 billion before the open market sale, and the reserve requirement was 10 percent of these deposits. Barclays l: excess reserves with the Fed. \f


