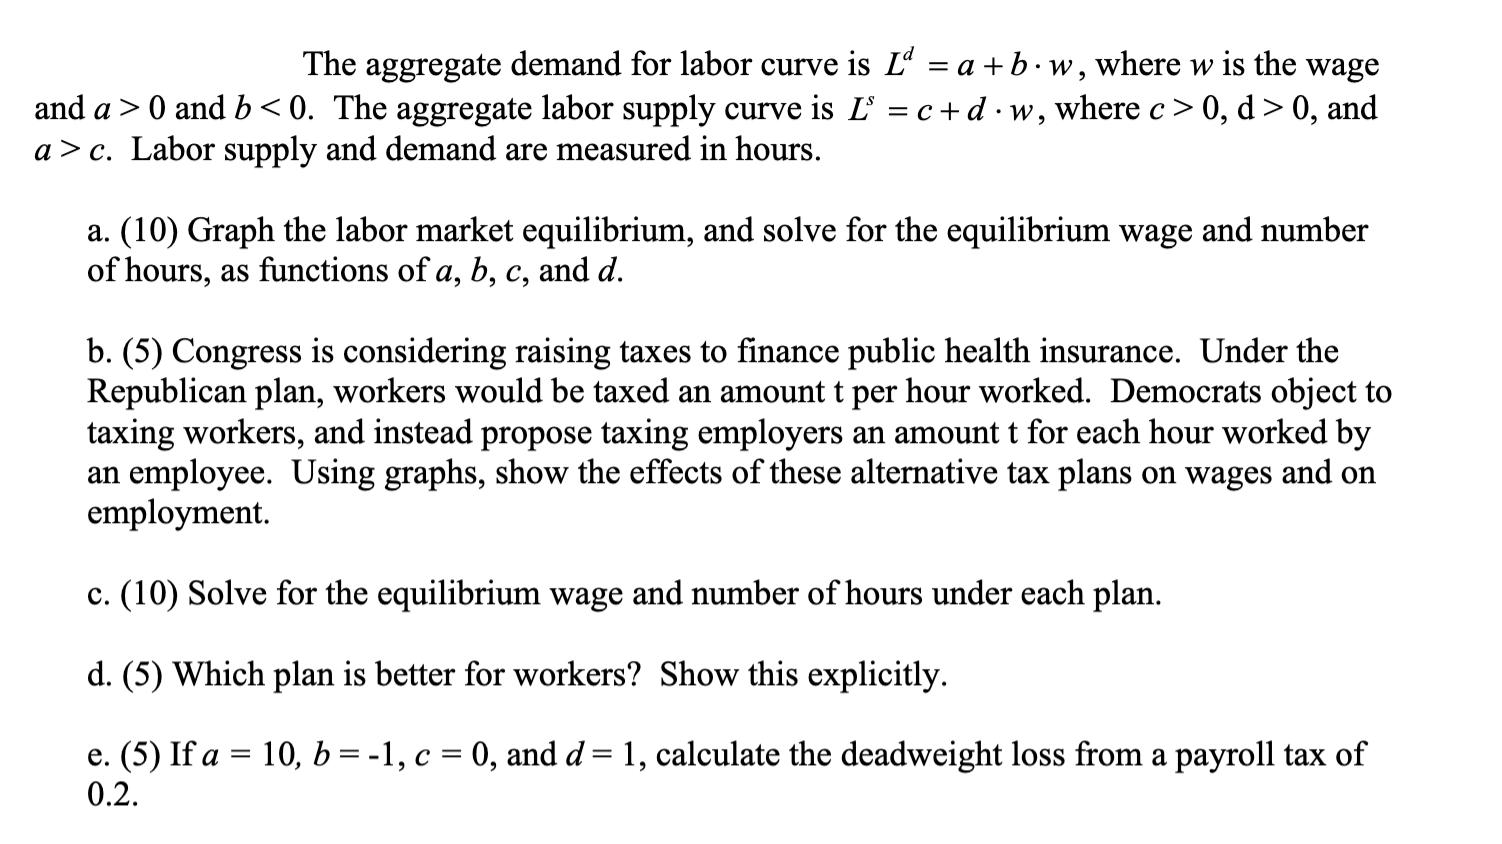
The aggregate demand for labor curve is L = a + b. w, where w is the wage and a > 0 and b

The aggregate demand for labor curve is L = a + b. w, where w is the wage and a > 0 and b 0, d>0, and a> c. Labor supply and demand are measured in hours. . a. (10) Graph the labor market equilibrium, and solve for the equilibrium wage and number of hours, as functions of a, b, c, and d. b. (5) Congress is considering raising taxes to finance public health insurance. Under the Republican plan, workers would be taxed an amount t per hour worked. Democrats object to taxing workers, and instead propose taxing employers an amount t for each hour worked by an employee. Using graphs, show the effects of these alternative tax plans on wages and on employment. c. (10) Solve for the equilibrium wage and number of hours under each plan. d. (5) Which plan is better for workers? Show this explicitly. e. (5) If a = 10, b = -1, c = 0, and d = 1, calculate the deadweight loss from a payroll tax of 0.2.
Step by Step Solution
3.37 Rating (150 Votes )
There are 3 Steps involved in it
Step: 1
a Graph the labor market equilibrium The labor market equilibrium can be graphically represented as ...
See step-by-step solutions with expert insights and AI powered tools for academic success
Step: 2

Step: 3

Ace Your Homework with AI
Get the answers you need in no time with our AI-driven, step-by-step assistance
Get Started


