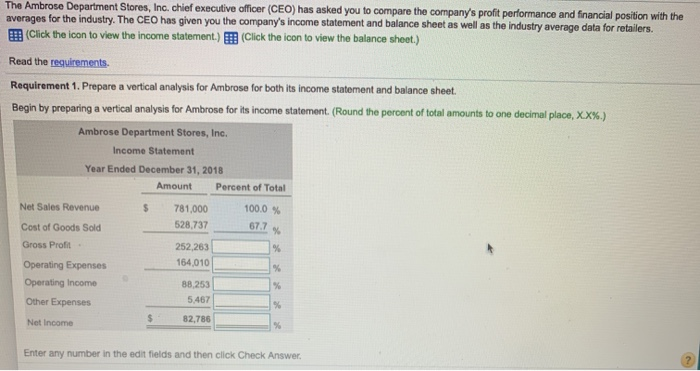
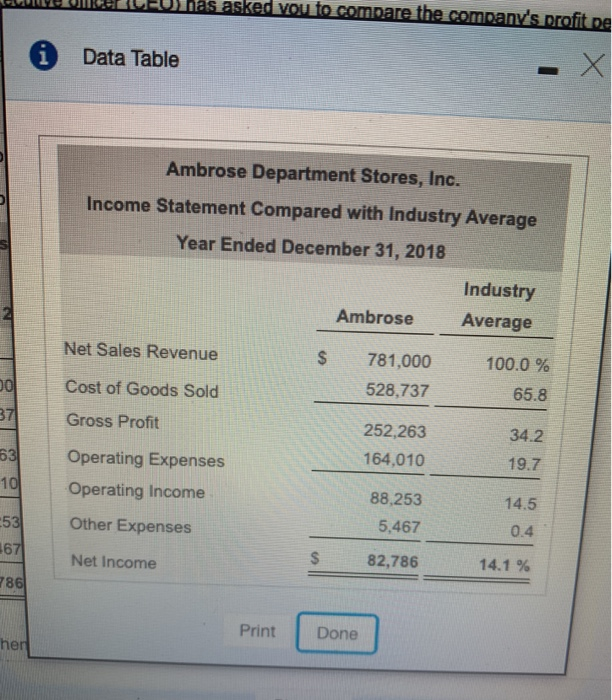
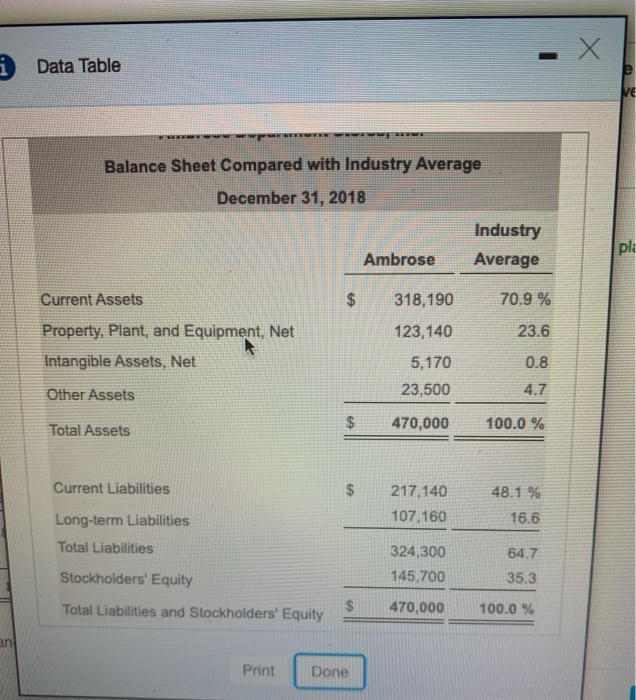
The Ambrose Department Stores, Inc. chief executive officer (CEO) has asked you to compare the company's profit performance and financial position with the averages for the industry. The CEO has given you the company's income statement and balance sheet as well as the industry average data for retailers. Click the icon to view the income statement.) Click the icon to view the balance sheet.) Read the requirements. Requirement 1. Prepare a vertical analysis for Ambrose for both its income statement and balance sheet. Begin by preparing a vertical analysis for Ambrose for its income statement. (Round the percent of total amounts to one decimal place, XX%.) Ambrose Department Stores, Inc. Income Statement Year Ended December 31, 2018 Amount Percent of Total Net Sales Revenue $ 781,000 528.737 Cost of Goods Sold 100.0 % 67.7 % % Gross Profit 252,263 164,010 % Operating Expenses Operating Income Other Expenses % 88.253 5,467 % Net Income 82,786 % Enter any number in the edit fields and then click Check Answer das asked vou to compare the company's profit de i Data Table Ambrose Department Stores, Inc. Income Statement Compared with Industry Average Year Ended December 31, 2018 Industry Ambrose Average 2. Net Sales Revenue $ 100.0 % 781,000 528,737 Cost of Goods Sold 00 37 65.8 Gross Profit 252,263 164,010 63 34.2 19.7 101 Operating Expenses Operating Income 88.253 5,467 -53 Other Expenses 14.5 0.4 167 Net Income $ 82,786 14.1 % 786 Print Done her i Data Table VE EESTE Balance Sheet Compared with Industry Average December 31, 2018 Industry Average ple Ambrose Current Assets $ 318,190 70.9 % 23.6 Property, Plant, and Equipment, Net Intangible Assets, Net 123,140 5,170 23,500 0.8 Other Assets 4.7 $ 470,000 Total Assets 100.0 % Current Liabilities $ 48.1 % 217.140 107,160 16.6 Long-term Liabilities Total Liabilities 64.7 324,300 145,700 Stockholders' Equity 35.3 Total Liabilities and Stockholders' Equity $ 470,000 100.0 % an Print Done