Answered step by step
Verified Expert Solution
Question
1 Approved Answer
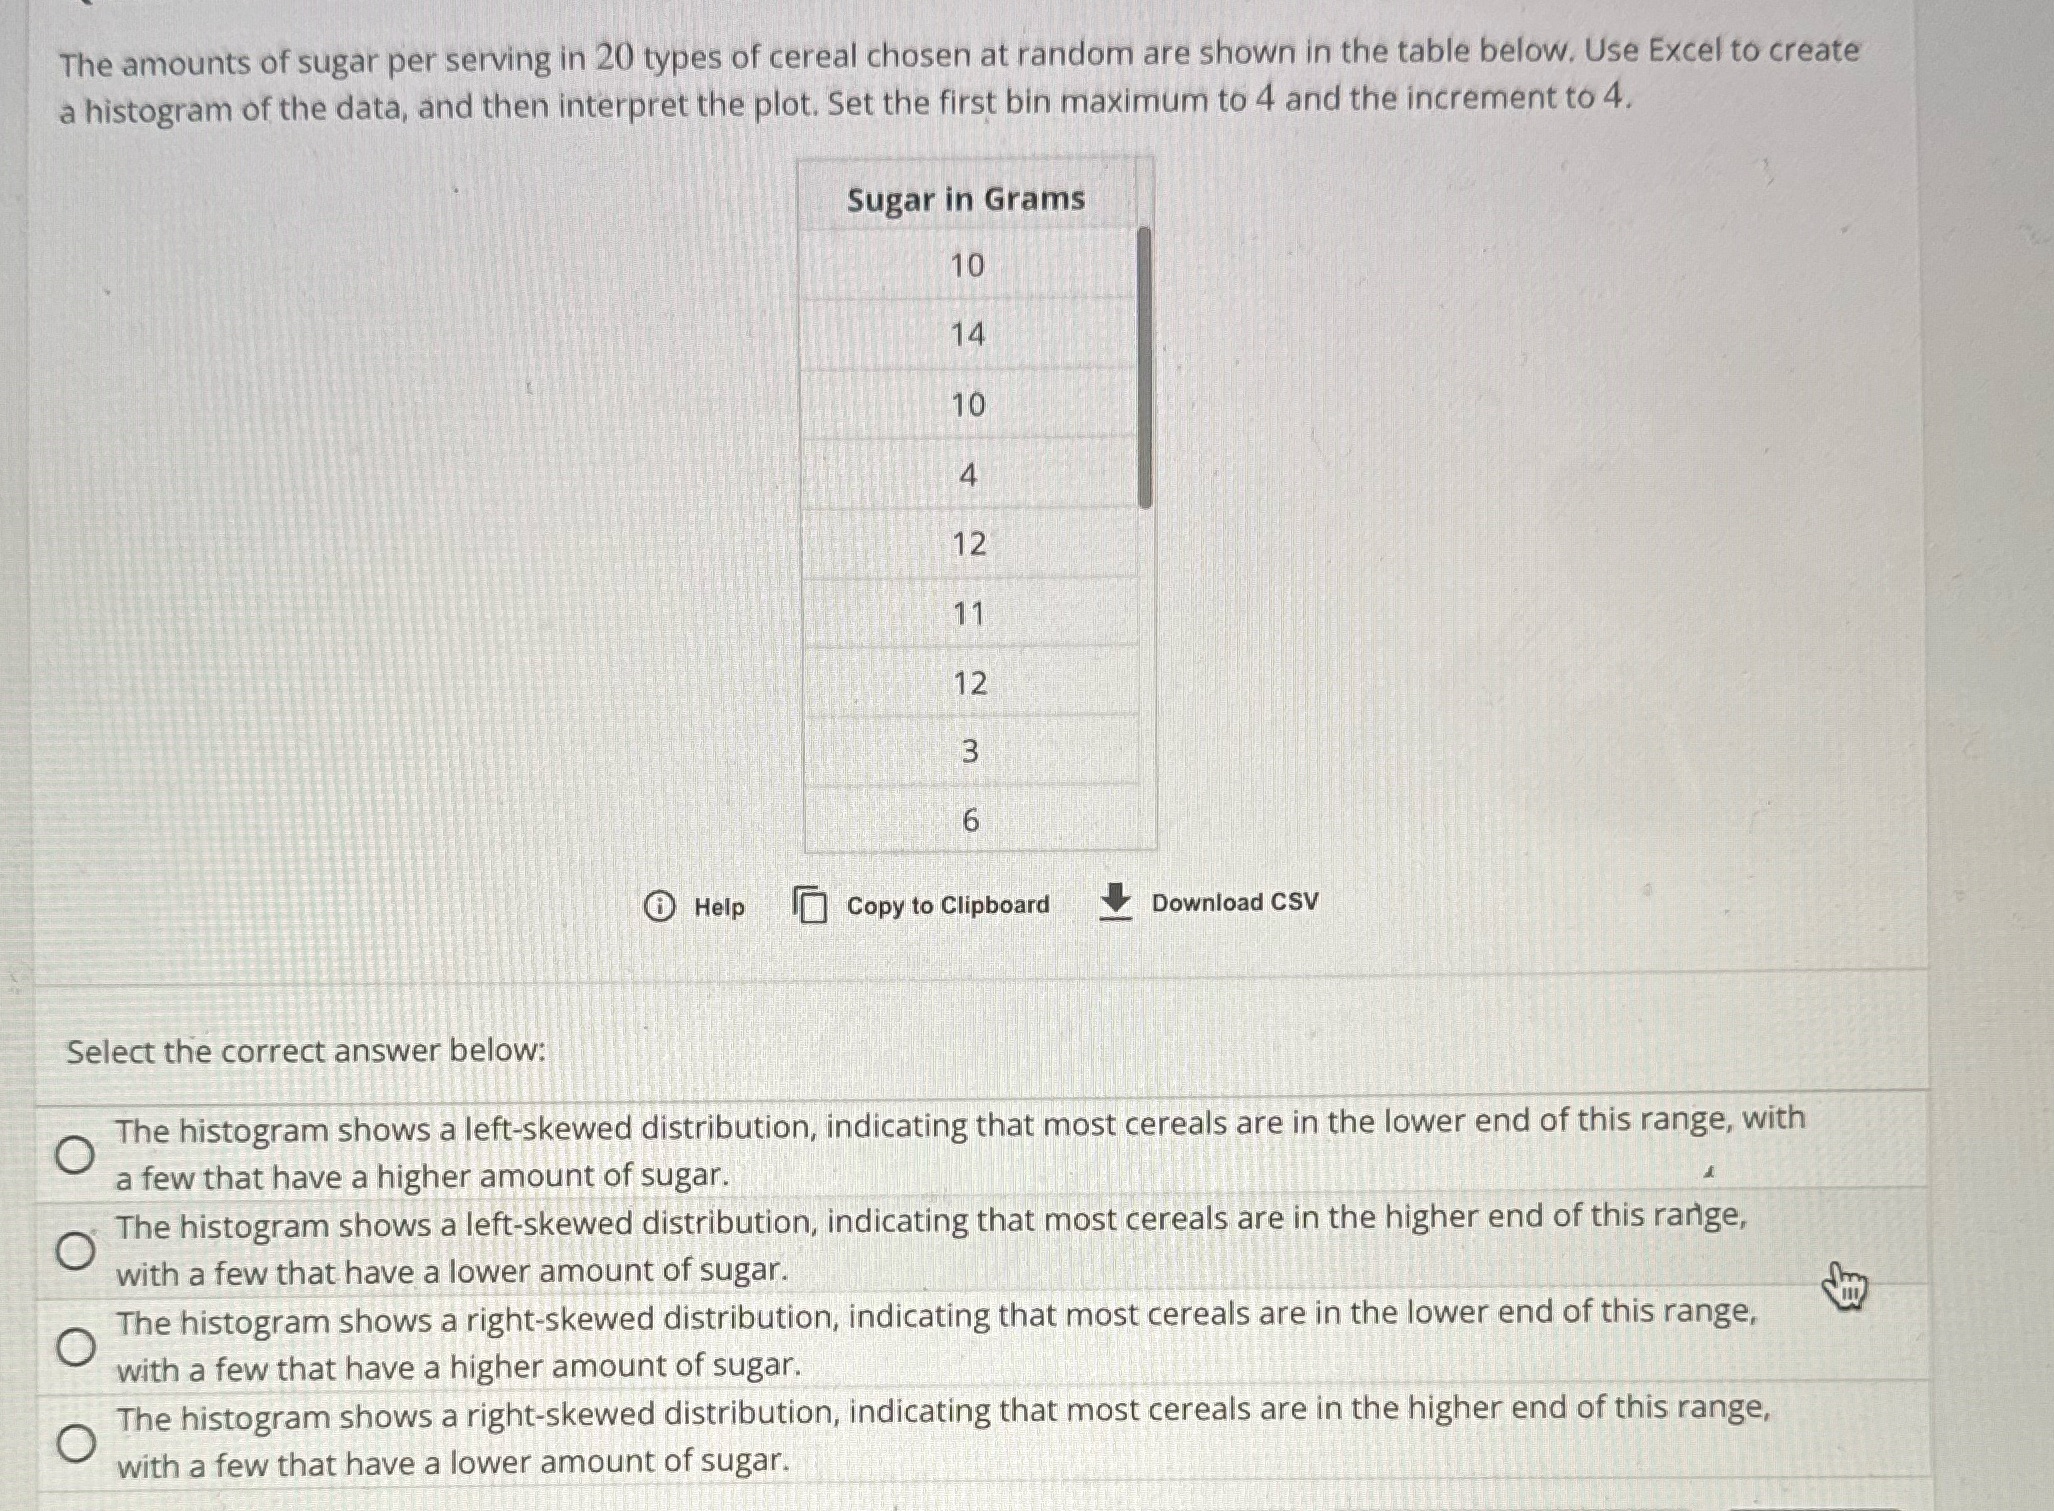
The amounts of sugar per serving in 20 types of cereal chosen at random are shown in the table below. Use Excel to create

The amounts of sugar per serving in 20 types of cereal chosen at random are shown in the table below. Use Excel to create a histogram of the data, and then interpret the plot. Set the first bin maximum to 4 and the increment to 4. Sugar in Grams 10 14 10 4 12 11 12 2=236 Help Copy to Clipboard Download CSV Select the correct answer below: O O O O The histogram shows a left-skewed distribution, indicating that most cereals are in the lower end of this range, with a few that have a higher amount of sugar. The histogram shows a left-skewed distribution, indicating that most cereals are in the higher end of this range, with a few that have a lower amount of sugar. The histogram shows a right-skewed distribution, indicating that most cereals are in the lower end of this range, with a few that have a higher amount of sugar. The histogram shows a right-skewed distribution, indicating that most cereals are in the higher end of this range, with a few that have a lower amount of sugar.
Step by Step Solution
There are 3 Steps involved in it
Step: 1
Given the data provided the histogram will show the distribution of sugar content based on the ...
Get Instant Access to Expert-Tailored Solutions
See step-by-step solutions with expert insights and AI powered tools for academic success
Step: 2

Step: 3

Ace Your Homework with AI
Get the answers you need in no time with our AI-driven, step-by-step assistance
Get Started


