

Answered step by step
Verified Expert Solution
Question
1 Approved Answer
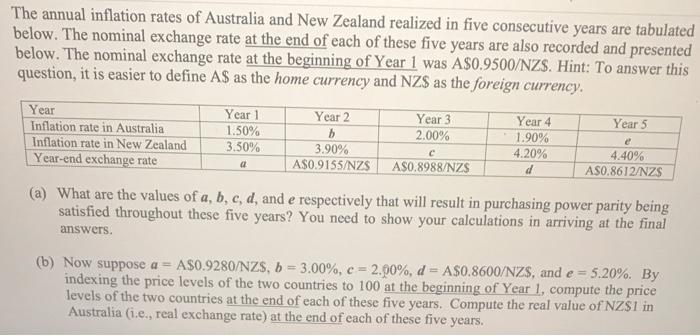
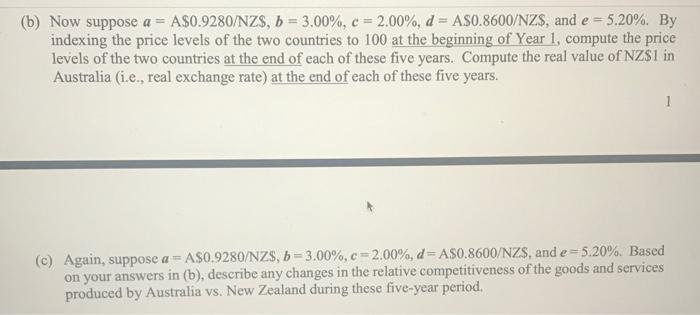
The annual inflation rates of Australia and New Zealand realized in five consecutive years are tabulated below. The nominal exchange rate at the end of
Step by Step Solution
There are 3 Steps involved in it
Step: 1

Get Instant Access to Expert-Tailored Solutions
See step-by-step solutions with expert insights and AI powered tools for academic success
Step: 2

Step: 3
Ace Your Homework with AI
Get the answers you need in no time with our AI-driven, step-by-step assistance
Get Started
Crisis Risk And Stability In Financial Markets
Authors: Juan Fernández De Guevara Radoselovics , José Pastor Monsálvez
1st Edition
1137001828, 978-1137001825