Answered step by step
Verified Expert Solution
Question
1 Approved Answer
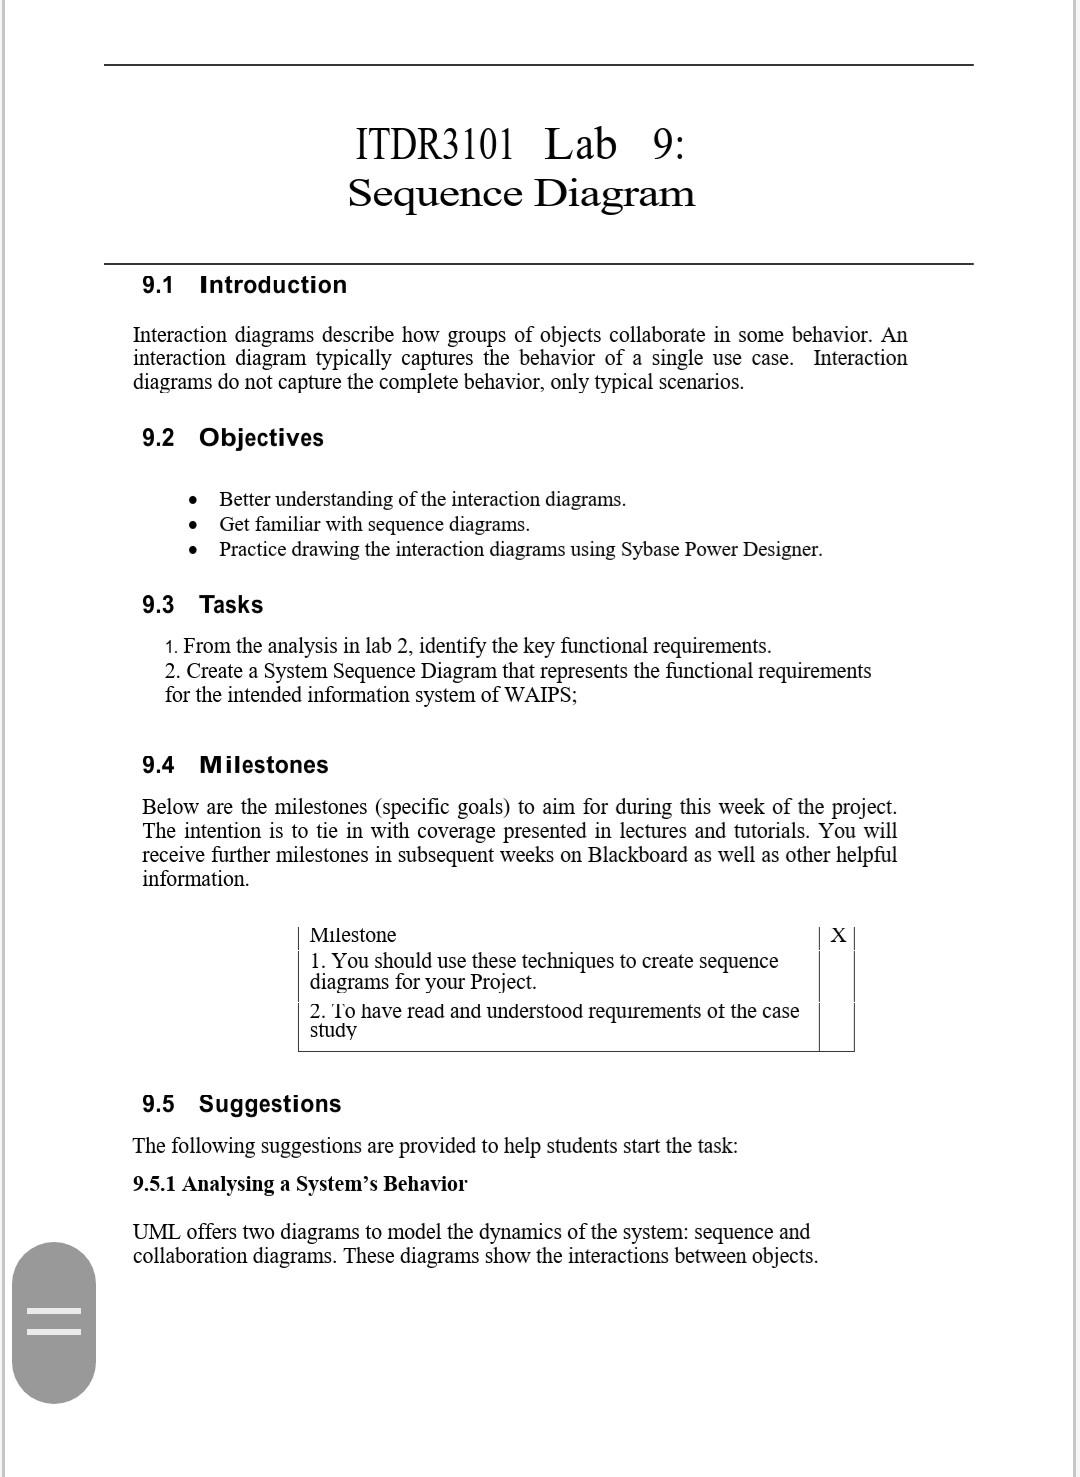
The answer should be clear Please ITDR3101 Lab 9: Sequence Diagram 9.1 Introduction Interaction diagrams describe how groups of objects collaborate in some behavior. An


The answer should be clear Please
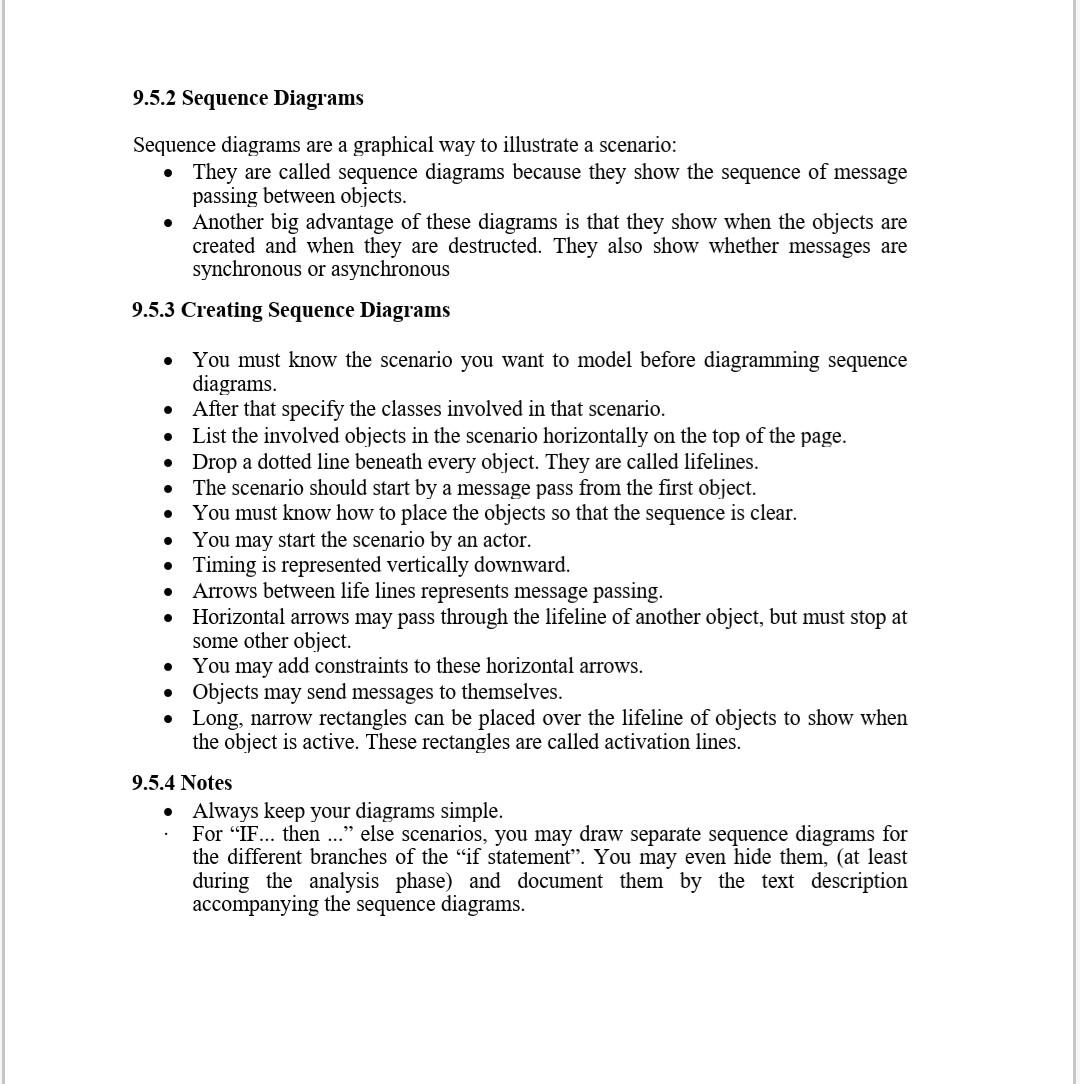
ITDR3101 Lab 9: Sequence Diagram 9.1 Introduction Interaction diagrams describe how groups of objects collaborate in some behavior. An interaction diagram typically captures the behavior of a single use case. Interaction diagrams do not capture the complete behavior, only typical scenarios. 9.2 Objectives . Better understanding of the interaction diagrams. Get familiar with sequence diagrams. Practice drawing the interaction diagrams using Sybase Power Designer. 9.3 Tasks 1. From the analysis in lab 2, identify the key functional requirements. 2. Create a System Sequence Diagram that represents the functional requirements for the intended information system of WAIPS; 9.4 Milestones Below are the milestones (specific goals) to aim for during this week of the project. The intention is to tie in with coverage presented in lectures and tutorials. You will receive further milestones in subsequent weeks on Blackboard as well as other helpful information. X Milestone 1. You should use these techniques to create sequence diagrams for your Project. 2. To have read and understood requirements of the case study 9.5 Suggestions The following suggestions are provided to help students start the task: 9.5.1 Analysing a System's Behavior UML offers two diagrams to model the dynamics of the system: sequence and collaboration diagrams. These diagrams show the interactions between objects. = 9.5.2 Sequence Diagrams Sequence diagrams are a graphical way to illustrate a scenario: They are called sequence diagrams because they show the sequence of message passing between objects. Another big advantage of these diagrams is that they show when the objects are created and when they are destructed. They also show whether messages are synchronous or asynchronous . 9.5.3 Creating Sequence Diagrams . You must know the scenario you want to model before diagramming sequence diagrams. After that specify the classes involved in that scenario. List the involved objects in the scenario horizontally on the top of the page. Drop a dotted line beneath every object. are called lifelines. The scenario should start by a message pass from the first object. You must know how to place the objects so that the sequence is clear. You may start the scenario by an actor. Timing is represented vertically downward. Arrows between life lines represents message passing. Horizontal arrows may pass through the lifeline of another object, but must stop at some other object. You may add constraints to these horizontal arrows. Objects may send messages to themselves. Long, narrow rectangles can be placed over the lifeline of objects to show when the object is active. These rectangles are called activation lines. . 9.5.4 Notes Always keep your diagrams simple. For "IF... then ..." else scenarios, you may draw separate sequence diagrams for the different branches of the if statement. You may even hide them, (at least during the analysis phase) and document them by the text description accompanying the sequence diagramsStep by Step Solution
There are 3 Steps involved in it
Step: 1

Get Instant Access to Expert-Tailored Solutions
See step-by-step solutions with expert insights and AI powered tools for academic success
Step: 2

Step: 3

Ace Your Homework with AI
Get the answers you need in no time with our AI-driven, step-by-step assistance
Get Started


