

Question
The area marked by the e (between line c and line i) on this CVP graph (where the vertical axis represents dollars and the horizontal
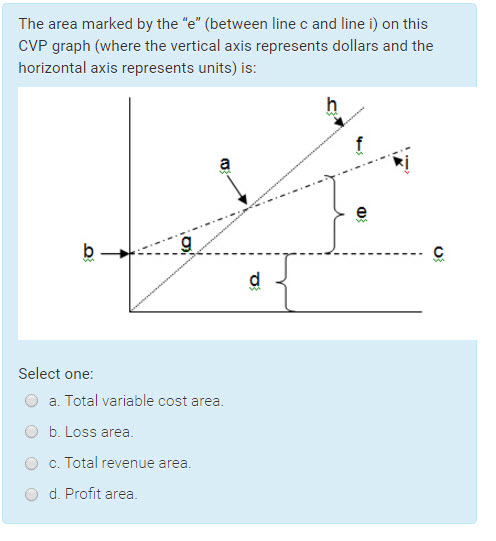
The area marked by the e (between line c and line i) on this CVP graph (where the vertical axis represents dollars and the horizontal axis represents units) is:
a. Total variable cost area.
b. Loss area.
c. Total revenue area.
d. Profit area.
Step by Step Solution
There are 3 Steps involved in it
Step: 1

Get Instant Access to Expert-Tailored Solutions
See step-by-step solutions with expert insights and AI powered tools for academic success
Step: 2

Step: 3
Ace Your Homework with AI
Get the answers you need in no time with our AI-driven, step-by-step assistance
Get Started
Budget Responsibility And National Audit Bill Source Book Edition Current Political Debates Of The UK Parliament 55th Parliament Volume
Authors: Jeff Nelson
1st Edition
3845468017, 978-3845468013