

Answered step by step
Verified Expert Solution
Question
1 Approved Answer
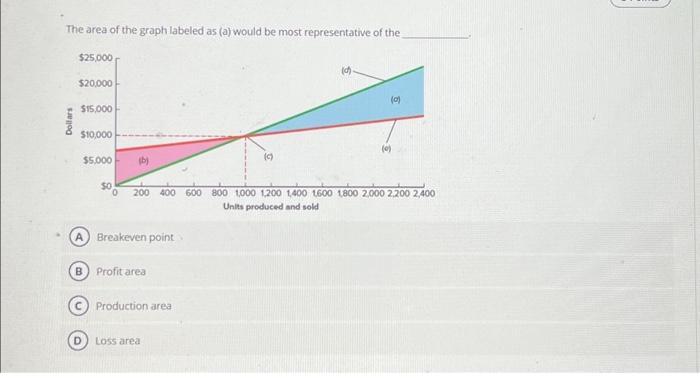
The area of the graph labeled as (a) would be most representative of the Dollars $25,000 $20,000 $15,000 $10,000 $5,000 A B 500 (b) 200
The area of the graph labeled as (a) would be most representative of the Dollars $25,000 $20,000 $15,000 $10,000 $5,000 A B 500 (b) 200 400 600 Breakeven point Profit area Production area Loss area (c) (d) (e) 800 1,000 1,200 1,400 1,600 1,800 2,000 2,200 2,400 Units produced and sold
Step by Step Solution
There are 3 Steps involved in it
Step: 1

Get Instant Access to Expert-Tailored Solutions
See step-by-step solutions with expert insights and AI powered tools for academic success
Step: 2

Step: 3
Ace Your Homework with AI
Get the answers you need in no time with our AI-driven, step-by-step assistance
Get Started
Handbook On Energy Audit And Environment Management
Authors: Y.P. Abbi, Shashank Jain
1st Edition
8179930920, 978-8179930922