The article and questions provided. 
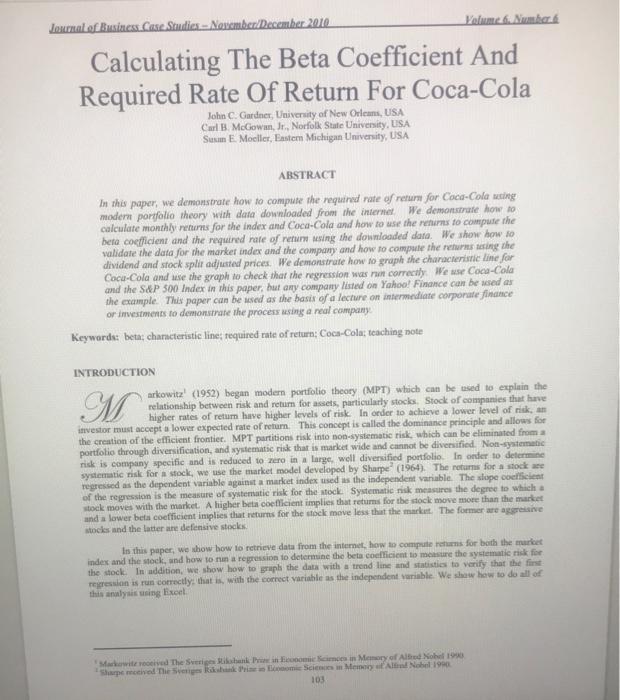
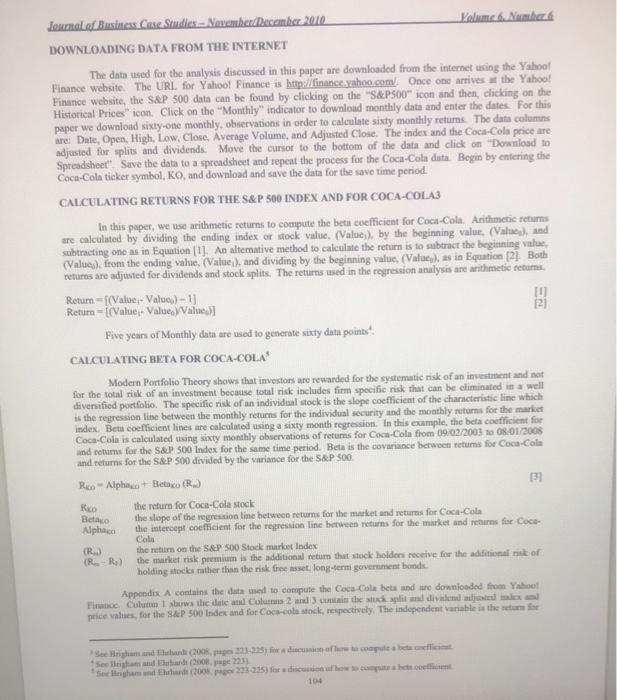
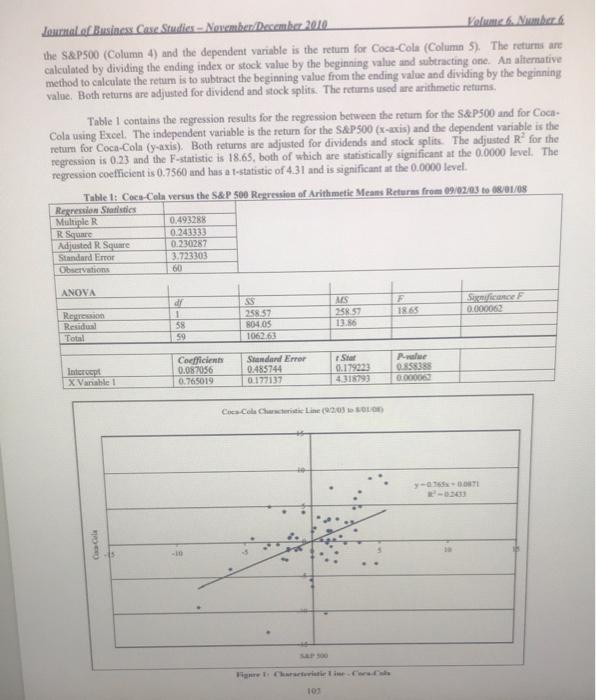
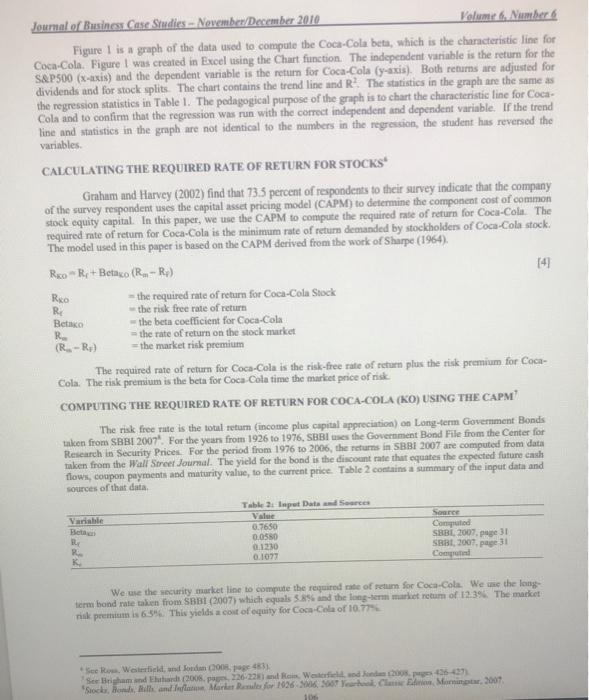
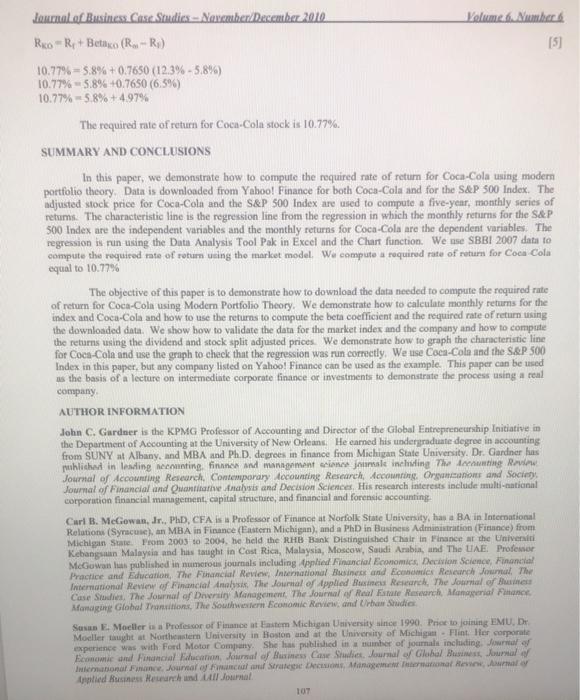
ons for Coca Cola Case Can you find a crat in equation Look at Figure 1, bow will does the repremio de predict the actual resultsWhat does the Rain the repression equation (table) and Does this ove you contidence in the Galata or not The authors every long term anges to estimate risk free rate and market premium, Ware the benefits and of the Would you be a different ang at number Discuss the Beta results of the calculation. What does it mean Does it make sense to you with what you know about Coca Cola Check the cost of equity determined in the car against the current Coca Cola stock price find the recent rowth rate and use the formule Return on equity (Oldende year divided by current price browth rate it dou, if not why would it be different Volume 6 Number Journal of Business Case Studies - November December 2010 Calculating The Beta Coefficient And Required Rate Of Return For Coca-Cola John C. Gardner, University of New Orleans, USA Carl McGowan, Jr., Norfolk State University, USA Susan E. Moeller, Eastem Michigan University, USA ABSTRACT In this paper, we demonstrate how to compute the required rate of return for Coca-Cola ting modern portfolio theory with data downloaded from the internet We demonstrate how to calculate monthly returns for the index and Coca-Cola and how to use the returns to compute the beto coefficient and the required rate of return asing the downloaded date. We show how to validate the data for the market index and the company and how to compute the returns using the dividend and stock splir adjusted prices. We demonstrate how to graph the characteristic line for Coca-Cola and use the graph to check that the regression was run correctly. We use Coca-Cola and the S&P 500 Index in this paper, hut any company listed on Yahoo! Finance can be used as the example. This paper can be used as the basis of a lecture on intermediare corporate finance or investments to demonstrate the process using a real company Keywords: beta characteristic lines required rate of return: Coca-Cola; teaching note INTRODUCTION arkowitz' (1952) began modern portfolio theory (MPT) which can be used to explain the relationship between risk and return for assets, particularly stocks. Stock of companies that have 1 higher rates of retum have higher levels of risk in order to achieve a lower level of riska investor must accept a lower expected rate of return. This concept is called the dominance principle and allows for the creation of the efficient frontier. MPT partitions risk into non-systematic risk, which can be eliminated from portfolio through diversification, and systematic risk that is market wide and cannot be diversified Non-systematic risk is company specific and is reduced to zero in a large, well diversified portfolio. In order to determine systematic risk for a stock, we use the market model developed by Sharpe (1964). The returns for a stock are regressed as the dependent variable against a market index used as the independent variable. The slope coerent of the regression is the measure of systematic risk for the stock. Systematic risk measures the degree to which a stock moves with the market. A higher beta coefficient implies that returns for the stock move more than the market and a lower beta coefficient implies that returns for the stock move less that the market. The former are aggressive stocks and the latter are defensive stock In this paper, we show how to retrieve data from the internet, how to computerens for both the market index and the stock, and how to nin a regression to determine the beta coefficient to mensure the systematic risk for the stock. In addition, we show how to gruph the data with a trend line and statisties to verify that the first repression is run correctly, that is with the correct variable as the independent variable. We how how to do all of this analysis using Excel. Markowited The Sveriges Rank Prin comme Memory of Abd Mohd 1990 Shape moved The Prime Scene Memey Al Nobel 1900 103 Zonnal of Business Case Studies - Noche December 2010 almedabad DOWNLOADING DATA FROM THE INTERNET The data used for the analysis discussed in this paper are downloaded from the internet using the Yahoo! Finance website. The URL for Yahool Finance is http://finance.yahoo.com. Once one arrives at the Yahoo! Finance website, the S&P 500 data can be found by clicking on the "S&P500" icon and then clicking on the Historical Prices" icon. Click on the "Monthly indicator to download monthly data and enter the dates. For this paper we download sixty-one monthly, observations in order to calculate sixty monthly retums. The data columns are: Date, Open, High Low Close, Average Volume, and Adjusted Clost. The index and the Coca-Cola price are adjusted for splits and dividends: Move the cursor to the bottom of the data and click on "Download to Spreadsheet" Save the data to a spreadsheet and repeat the process for the Coca-Cola data Begin by entering the Coca-Cola ticker symbol, KO, and download and save the data for the save time period CALCULATING RETURNS FOR THE S&P 500 INDEX AND FOR COCA-COLA3 In this paper, we use arithmetic returns to compute the beta coefficient for Coca-Cola, Arithmetic returns are calculated by dividing the ending index or stock value, (Vale), by the beginning value. (Value), and subtracting one as in Equation [U]. An alternative method to calculate the return is to subtract the beginning value, (Value) from the ending value, (Value) and dividing by the beginning value (Value, as in Equation (2) Both returns are adjusted for dividends and stock splits. The returns used in the regression analysis are arithmetic retur Return-[(Value - Value) - 1] Retum =((Value Value Value] 21 Five years of Monthly data are used to generate sixty duta points CALCULATING BETA FOR COCA-COLA Modern Portfolio Theory shows that investors are rewarded for the systematic risk of an investment and not for the total risk of an investment because total risk includes fimm specific risk that can be eliminated in a well diversified portfolio. The specific risk of an individual stock is the slope coefficient of the characteristic line which is the regression line between the monthly returns for the individual security and the monthly returns for the market index. Beta coefficient lines are calculated using a sixty month regression. In this example, the beta coefficient for Coca-Cola is calculated using sixty monthly observations of returns for Coca-Cola from 09:02/2003 1 08.01.2008 and returns for the S&P 500 Index for the same time period. Bata is the covariance between returns for Coca-Cola and returns for the S&P 500 divided by the variance for the S&P 500 Rico Alpha Beta (R.) 133 the return for Coca-Cola stock the slope of the regression line between returns for the market and returns for Coca-Cola Alpha the intercept coefficient for the regression line between returns for the market and returns for Coca- Cola R.) the return on the S&P 500 Stock market Index ( RR. the market risk premium is the additional return that stockholders receive for the additional of holding stocks rather than the risk free musiet, long-term government bonds Appendix A contains the data used to compute the Coca-Cola bets and re downloaded from Yahoo F. Column 1 laws the date and Columns 2 in the stupid and dividemme price values, for the S&P 500 Iridex and for Coca-cola stock, respectively. The independent variable is the sum for Rico Bac See Brigmand hand (2008.pages for computea beti See haladt (2008, 225 Stihamlande (2008273215) Barachowice 104 Journal of Business Case Studies -- November December 2010 Volume the S&P500 (Column 4) and the dependent variable is the return for Coca-Cola (Column 5). The returns are calculated by dividing the ending index or stock value by the beginning value and subtracting one. An alternative method to calculate the retum is to subtract the beginning value from the ending value and dividing by the beginning value. Both returns are adjusted for dividend and stock splits. The returns used are arithmetic returns Table 1 contains the regression results for the regression between the return for the S&P500 and for Coca- Cola using Excel. The independent variable is the return for the S&P500(x-axis) and the dependent variable is the retum for Coca-Cola (y-axis). Both returns are adjusted for dividends and stock splits. The adjusted R for the regression is 0.23 and the F-statistic is 18.65, both of which are statistically significant at the 0.0000 level. The regression coefficient is 0.7560 and has a 1-statistic of 4.31 and is significant at the 0.0000 level. Table 1: Coca-Cola versus the S&P 500 Regression of Arithmetic Means Returns from 09/02/03 to 18/01/08 Regression Statistics Multiple R R Square Adjusted R Square 0.4932R 0.243333 0.230287 3.723303 60 Standard Error Observations ANOVA F 18.65 Since 0.000062 Region Residus Total MS 258.57 13.30 dr 1 58 59 SS 258.57 804.05 106263 Star Intercept X Vinable Coefficients 0.087056 0.765019 Standard Error 0.485744 0.177137 0.179223 4318793 Pue 0858385 0000067 Coca-Cola Christie Line (203 LOLO y-DOTI Oracle S&P 500 103 Journal of Business Case Studies - November December 2010 Volume 6. Namber Figure 1 is a graph of the data used to compute the Coca-Cola beta, which is the characteristic line for Coca-Cola. Figure I was created in Excel using the Chart function. The independent variable is the return for the S&P500 (x-axis) and the dependent variable is the return for Coca-Cola (y-axis). Both returns are adjusted for dividends and for stock splits. The chart contains the trend line and R? The statistics in the graph are the same as the regression statistics in Table 1. The pedagogical purpose of the graph is to chart the characteristic line for Coca- Cola and to confirm that the regression was run with the correct independent and dependent variable. If the trend line and statistics in the graph are not identical to the numbers in the regression, the student has reversed the variables CALCULATING THE REQUIRED RATE OF RETURN FOR STOCKS Grahum and Harvey (2002) find that 73.5 percent of respondents to their survey indicate that the company of the survey respondent uses the capital asset pricing model (CAPM) to determine the component cost of common stock equity capital . In this paper, we use the CAPM to compute the required rate of return for Coca-Cola. The required rate of return for Coca-Cola is the minimum rate of return demanded by stockholders of Coca-Cola stock. The model used in this paper is based on the CAPM derived from the work of Sharpe (1964), Rxo Rs+ Betaxo (R.-R) 14 RO -the required rate of return for Coca-Cola Stock R the risk free rate of return Betako -the beta coefficient for Coca-Cola R the rate of return on the stock market (R.-R) = the market risk premium The required rate of return for Coca-Cola is the risk-free rate of return plus the risk premium for Coca- Cola. The risk premium is the beta for Coca Cola time the market price of risk COMPUTING THE REQUIRED RATE OF RETURN FOR COCA-COLA (KO) USING THE CAPM The risk free rute is the total return (income plus capital appreciation) Long-term Government Bonds taken from SBBI 2007 For the years from 1926 to 1976, SBBIs the Government Bond File from the Center for Research in Security Price. For the period from 1976 to 2006, the returns in SBBI 2007 are computed from data taken from the Wall Street Journal. The yield for the bond is the discount rate that equates the expected future cash flows, coupon payments and maturity value to the current price Table 2 contains a summary of the input data and sources of that data Table 2. Laput Dalam Sarees Variable Value Source Beta Computed 0.0580 SRBI, 2007, page 31 SRBE, 2007, page 3 0.1077 Congratul 0.7650 0.120 We use the security market line to compute the required rate of return for Coca-Cola. We me the long- term bond rate taken from SBB (2007) which equals 5.8% and the long-term muret retum of 12:39. The market risk premium is 6.5". This yields a cost of equity for Coca-Cola of 10.77% See Wested and fondan0043 See mund (2008.226-22 and Western 2006-27 Socks, Bill and Marker Rules for 1926. SO Yar Can Murningar 2007 100 local of Business Case Studies - November December 2010 Volume RKOR+Betaco (Ro-R) [5] 10.77%= 5.8%+0.7650 (12,3% -5,8%) 10.77% 5.8% +0.7650 (6,5%) 10.77% 5.8%+4.97% The required rate of return for Coca-Cola stock is 10.77%. SUMMARY AND CONCLUSIONS In this paper, we demonstrate how to compute the required rate of return for Coca-Cola using modern portfolio theory. Data is downloaded from Yahoo! Finance for both Coca-Cola and for the S&P 500 Index. The ndjusted stock price for Coca-Cola and the S&P 500 Index are used to computea five-year, monthly series of retums. The characteristic line is the regression line from the regression in which the monthly returns for the S&P 500 Index are the independent variables and the monthly returns for Coca-Cola are the dependent variables. The regression is run using the Data Analysis Tool Pak in Excel and the Chart function. We me SBBI 2007 data to compute the required rate of rotor using the market model. We computea required rate of return for Coca Cola equal to 10.77% The objective of this paper is to demonstrate how to download the data needed to compute the required rate of return for Coca-Cola using Modern Portfolio Theory. We demonstrate how to calculate monthly returns for the index and Coca-Cola and how to use the returns to compute the beta coefficient and the required rate of return using the downloaded data. We show how to validate the data for the market index and the company and how to compute the returns using the dividend and stock split adjusted prices. We demonstrate how to graph the characteristic line for Coca-Cola and use the graph to check that the regression was run correctly. We use Coca-Cola and the S&P 500 Index in this paper, but any company listed on Yahoo! Finance can be used as the example. This paper can be used is the basis of a lecture on intermediate corporate finance or investments to demonstrate the process using a real company AUTHOR INFORMATION John C. Gardner is the KPMG Professor of Accounting and Director of the Global Entrepreneurship Initiative in the Department of Accounting at the University of New Orleans. He carned his undergraduate degree in accounting from SUNY at Albany, and MBA and Ph.D. degrees in finance from Michigan State University, Dr. Gardner hins published in leading recounting finner and management in jumale including The Arte Review Journal of Accounting Research Contemporary tocounting Research, Accounting Organcanons and Society Journal of Financial and Quantitate Analysis and Decision Sciences His research interests include multi-national corporation financial management, capital structure, and financial and forensic accounting Carl B. McGowan, Jr., PhD, CFA is a Professor of Finance at Norfolk State University, has a BA in International Relations (Syracuse), an MBA in Finance (Eastern Michigan), and a PhD in Business Administration (Finance) from Michigan State. From 2003 to 2004, he held the RHB Bank Distinguished Chair in Finance at the Universiti Kebangsaan Malaysia and his taught in Cost Rica, Malaysia, Moscow, Saudi Arabia, and The UAE Professor McGowan las published in numerous journals including applied Financial Economics, Decision Science Financial Practice and Education, The Financial Review International Business and Ecoceles Research Journal The International Review of Financial Analysis. The Journal of Applied Music Research. The Journal of Business Case Studies. The Journal of Duty Management. The Journal of Real Estate Research, Alamagerial Finance Mona Global Transitions. The Southwestern Economic Review, and Urban Studies Susan E. Moeller is a Professor of Finance at Eastom Michigan University since 1990. Prior to joining EMUDr. Moeller tght at Northeastern University in Boston and at the University of Michigan - Flint. Her corporate experience was with Ford Motor Company. She has published in number of journals including, Journal of Economic and Financial canon, Journal of Business Case Studies, Journal of Global Business Journal International Finance Journal of calcol Strateg, Managementencomat e Arnav plied Business Hell Journal TOT Journal of Business Case Studies - November/December 2010 Volume 6, Number 6 REFERENCES 1 2 3. 4. 5. 6. Brigham, Eugene F. and Michael C. Ehrhardt. Financial Management, Theory and Practice, Twelfth Edition, Thomson/Southwestern, Mason, OH, 2008. Damodaran, Aswath. Applied Corporate Finance." Second Edition, John Wiley&Sons, Inc., 2006, Graham, John R. and Campbell R. Harvey. "The Theory and Practice of Corporate Finance: Evidence form the Field." Journal of Financial Economics, 2002, pp. 187-243 http:obelprize.orgobel prizes/economics/laureates/1990/press.html Markowitz, Harry "Portfolio Selection," The Journal of Finance, March 1952, pp. 77-91. Ross, Stephen A., Randolph W. Westerfield, and Bradford D. Jordan. Fundamentals of Corporate Finance, Eighth Edition, McGraw-Hill Irwin, New York, 2008. William R. Sharpe, Capital Asset Prices: A Theory of Market Equilibrium under Conditions of Risk, The Journal of Finance, September 1964, pp. 425-552. Stocks, Bonds, Bills, and Inflation, Market Results for 1926 -2006, 2007 Yearbook, Classic Edition Morningstar, 2007 7. 8 ons for Coca Cola Case Can you find a crat in equation Look at Figure 1, bow will does the repremio de predict the actual resultsWhat does the Rain the repression equation (table) and Does this ove you contidence in the Galata or not The authors every long term anges to estimate risk free rate and market premium, Ware the benefits and of the Would you be a different ang at number Discuss the Beta results of the calculation. What does it mean Does it make sense to you with what you know about Coca Cola Check the cost of equity determined in the car against the current Coca Cola stock price find the recent rowth rate and use the formule Return on equity (Oldende year divided by current price browth rate it dou, if not why would it be different Volume 6 Number Journal of Business Case Studies - November December 2010 Calculating The Beta Coefficient And Required Rate Of Return For Coca-Cola John C. Gardner, University of New Orleans, USA Carl McGowan, Jr., Norfolk State University, USA Susan E. Moeller, Eastem Michigan University, USA ABSTRACT In this paper, we demonstrate how to compute the required rate of return for Coca-Cola ting modern portfolio theory with data downloaded from the internet We demonstrate how to calculate monthly returns for the index and Coca-Cola and how to use the returns to compute the beto coefficient and the required rate of return asing the downloaded date. We show how to validate the data for the market index and the company and how to compute the returns using the dividend and stock splir adjusted prices. We demonstrate how to graph the characteristic line for Coca-Cola and use the graph to check that the regression was run correctly. We use Coca-Cola and the S&P 500 Index in this paper, hut any company listed on Yahoo! Finance can be used as the example. This paper can be used as the basis of a lecture on intermediare corporate finance or investments to demonstrate the process using a real company Keywords: beta characteristic lines required rate of return: Coca-Cola; teaching note INTRODUCTION arkowitz' (1952) began modern portfolio theory (MPT) which can be used to explain the relationship between risk and return for assets, particularly stocks. Stock of companies that have 1 higher rates of retum have higher levels of risk in order to achieve a lower level of riska investor must accept a lower expected rate of return. This concept is called the dominance principle and allows for the creation of the efficient frontier. MPT partitions risk into non-systematic risk, which can be eliminated from portfolio through diversification, and systematic risk that is market wide and cannot be diversified Non-systematic risk is company specific and is reduced to zero in a large, well diversified portfolio. In order to determine systematic risk for a stock, we use the market model developed by Sharpe (1964). The returns for a stock are regressed as the dependent variable against a market index used as the independent variable. The slope coerent of the regression is the measure of systematic risk for the stock. Systematic risk measures the degree to which a stock moves with the market. A higher beta coefficient implies that returns for the stock move more than the market and a lower beta coefficient implies that returns for the stock move less that the market. The former are aggressive stocks and the latter are defensive stock In this paper, we show how to retrieve data from the internet, how to computerens for both the market index and the stock, and how to nin a regression to determine the beta coefficient to mensure the systematic risk for the stock. In addition, we show how to gruph the data with a trend line and statisties to verify that the first repression is run correctly, that is with the correct variable as the independent variable. We how how to do all of this analysis using Excel. Markowited The Sveriges Rank Prin comme Memory of Abd Mohd 1990 Shape moved The Prime Scene Memey Al Nobel 1900 103 Zonnal of Business Case Studies - Noche December 2010 almedabad DOWNLOADING DATA FROM THE INTERNET The data used for the analysis discussed in this paper are downloaded from the internet using the Yahoo! Finance website. The URL for Yahool Finance is http://finance.yahoo.com. Once one arrives at the Yahoo! Finance website, the S&P 500 data can be found by clicking on the "S&P500" icon and then clicking on the Historical Prices" icon. Click on the "Monthly indicator to download monthly data and enter the dates. For this paper we download sixty-one monthly, observations in order to calculate sixty monthly retums. The data columns are: Date, Open, High Low Close, Average Volume, and Adjusted Clost. The index and the Coca-Cola price are adjusted for splits and dividends: Move the cursor to the bottom of the data and click on "Download to Spreadsheet" Save the data to a spreadsheet and repeat the process for the Coca-Cola data Begin by entering the Coca-Cola ticker symbol, KO, and download and save the data for the save time period CALCULATING RETURNS FOR THE S&P 500 INDEX AND FOR COCA-COLA3 In this paper, we use arithmetic returns to compute the beta coefficient for Coca-Cola, Arithmetic returns are calculated by dividing the ending index or stock value, (Vale), by the beginning value. (Value), and subtracting one as in Equation [U]. An alternative method to calculate the return is to subtract the beginning value, (Value) from the ending value, (Value) and dividing by the beginning value (Value, as in Equation (2) Both returns are adjusted for dividends and stock splits. The returns used in the regression analysis are arithmetic retur Return-[(Value - Value) - 1] Retum =((Value Value Value] 21 Five years of Monthly data are used to generate sixty duta points CALCULATING BETA FOR COCA-COLA Modern Portfolio Theory shows that investors are rewarded for the systematic risk of an investment and not for the total risk of an investment because total risk includes fimm specific risk that can be eliminated in a well diversified portfolio. The specific risk of an individual stock is the slope coefficient of the characteristic line which is the regression line between the monthly returns for the individual security and the monthly returns for the market index. Beta coefficient lines are calculated using a sixty month regression. In this example, the beta coefficient for Coca-Cola is calculated using sixty monthly observations of returns for Coca-Cola from 09:02/2003 1 08.01.2008 and returns for the S&P 500 Index for the same time period. Bata is the covariance between returns for Coca-Cola and returns for the S&P 500 divided by the variance for the S&P 500 Rico Alpha Beta (R.) 133 the return for Coca-Cola stock the slope of the regression line between returns for the market and returns for Coca-Cola Alpha the intercept coefficient for the regression line between returns for the market and returns for Coca- Cola R.) the return on the S&P 500 Stock market Index ( RR. the market risk premium is the additional return that stockholders receive for the additional of holding stocks rather than the risk free musiet, long-term government bonds Appendix A contains the data used to compute the Coca-Cola bets and re downloaded from Yahoo F. Column 1 laws the date and Columns 2 in the stupid and dividemme price values, for the S&P 500 Iridex and for Coca-cola stock, respectively. The independent variable is the sum for Rico Bac See Brigmand hand (2008.pages for computea beti See haladt (2008, 225 Stihamlande (2008273215) Barachowice 104 Journal of Business Case Studies -- November December 2010 Volume the S&P500 (Column 4) and the dependent variable is the return for Coca-Cola (Column 5). The returns are calculated by dividing the ending index or stock value by the beginning value and subtracting one. An alternative method to calculate the retum is to subtract the beginning value from the ending value and dividing by the beginning value. Both returns are adjusted for dividend and stock splits. The returns used are arithmetic returns Table 1 contains the regression results for the regression between the return for the S&P500 and for Coca- Cola using Excel. The independent variable is the return for the S&P500(x-axis) and the dependent variable is the retum for Coca-Cola (y-axis). Both returns are adjusted for dividends and stock splits. The adjusted R for the regression is 0.23 and the F-statistic is 18.65, both of which are statistically significant at the 0.0000 level. The regression coefficient is 0.7560 and has a 1-statistic of 4.31 and is significant at the 0.0000 level. Table 1: Coca-Cola versus the S&P 500 Regression of Arithmetic Means Returns from 09/02/03 to 18/01/08 Regression Statistics Multiple R R Square Adjusted R Square 0.4932R 0.243333 0.230287 3.723303 60 Standard Error Observations ANOVA F 18.65 Since 0.000062 Region Residus Total MS 258.57 13.30 dr 1 58 59 SS 258.57 804.05 106263 Star Intercept X Vinable Coefficients 0.087056 0.765019 Standard Error 0.485744 0.177137 0.179223 4318793 Pue 0858385 0000067 Coca-Cola Christie Line (203 LOLO y-DOTI Oracle S&P 500 103 Journal of Business Case Studies - November December 2010 Volume 6. Namber Figure 1 is a graph of the data used to compute the Coca-Cola beta, which is the characteristic line for Coca-Cola. Figure I was created in Excel using the Chart function. The independent variable is the return for the S&P500 (x-axis) and the dependent variable is the return for Coca-Cola (y-axis). Both returns are adjusted for dividends and for stock splits. The chart contains the trend line and R? The statistics in the graph are the same as the regression statistics in Table 1. The pedagogical purpose of the graph is to chart the characteristic line for Coca- Cola and to confirm that the regression was run with the correct independent and dependent variable. If the trend line and statistics in the graph are not identical to the numbers in the regression, the student has reversed the variables CALCULATING THE REQUIRED RATE OF RETURN FOR STOCKS Grahum and Harvey (2002) find that 73.5 percent of respondents to their survey indicate that the company of the survey respondent uses the capital asset pricing model (CAPM) to determine the component cost of common stock equity capital . In this paper, we use the CAPM to compute the required rate of return for Coca-Cola. The required rate of return for Coca-Cola is the minimum rate of return demanded by stockholders of Coca-Cola stock. The model used in this paper is based on the CAPM derived from the work of Sharpe (1964), Rxo Rs+ Betaxo (R.-R) 14 RO -the required rate of return for Coca-Cola Stock R the risk free rate of return Betako -the beta coefficient for Coca-Cola R the rate of return on the stock market (R.-R) = the market risk premium The required rate of return for Coca-Cola is the risk-free rate of return plus the risk premium for Coca- Cola. The risk premium is the beta for Coca Cola time the market price of risk COMPUTING THE REQUIRED RATE OF RETURN FOR COCA-COLA (KO) USING THE CAPM The risk free rute is the total return (income plus capital appreciation) Long-term Government Bonds taken from SBBI 2007 For the years from 1926 to 1976, SBBIs the Government Bond File from the Center for Research in Security Price. For the period from 1976 to 2006, the returns in SBBI 2007 are computed from data taken from the Wall Street Journal. The yield for the bond is the discount rate that equates the expected future cash flows, coupon payments and maturity value to the current price Table 2 contains a summary of the input data and sources of that data Table 2. Laput Dalam Sarees Variable Value Source Beta Computed 0.0580 SRBI, 2007, page 31 SRBE, 2007, page 3 0.1077 Congratul 0.7650 0.120 We use the security market line to compute the required rate of return for Coca-Cola. We me the long- term bond rate taken from SBB (2007) which equals 5.8% and the long-term muret retum of 12:39. The market risk premium is 6.5". This yields a cost of equity for Coca-Cola of 10.77% See Wested and fondan0043 See mund (2008.226-22 and Western 2006-27 Socks, Bill and Marker Rules for 1926. SO Yar Can Murningar 2007 100 local of Business Case Studies - November December 2010 Volume RKOR+Betaco (Ro-R) [5] 10.77%= 5.8%+0.7650 (12,3% -5,8%) 10.77% 5.8% +0.7650 (6,5%) 10.77% 5.8%+4.97% The required rate of return for Coca-Cola stock is 10.77%. SUMMARY AND CONCLUSIONS In this paper, we demonstrate how to compute the required rate of return for Coca-Cola using modern portfolio theory. Data is downloaded from Yahoo! Finance for both Coca-Cola and for the S&P 500 Index. The ndjusted stock price for Coca-Cola and the S&P 500 Index are used to computea five-year, monthly series of retums. The characteristic line is the regression line from the regression in which the monthly returns for the S&P 500 Index are the independent variables and the monthly returns for Coca-Cola are the dependent variables. The regression is run using the Data Analysis Tool Pak in Excel and the Chart function. We me SBBI 2007 data to compute the required rate of rotor using the market model. We computea required rate of return for Coca Cola equal to 10.77% The objective of this paper is to demonstrate how to download the data needed to compute the required rate of return for Coca-Cola using Modern Portfolio Theory. We demonstrate how to calculate monthly returns for the index and Coca-Cola and how to use the returns to compute the beta coefficient and the required rate of return using the downloaded data. We show how to validate the data for the market index and the company and how to compute the returns using the dividend and stock split adjusted prices. We demonstrate how to graph the characteristic line for Coca-Cola and use the graph to check that the regression was run correctly. We use Coca-Cola and the S&P 500 Index in this paper, but any company listed on Yahoo! Finance can be used as the example. This paper can be used is the basis of a lecture on intermediate corporate finance or investments to demonstrate the process using a real company AUTHOR INFORMATION John C. Gardner is the KPMG Professor of Accounting and Director of the Global Entrepreneurship Initiative in the Department of Accounting at the University of New Orleans. He carned his undergraduate degree in accounting from SUNY at Albany, and MBA and Ph.D. degrees in finance from Michigan State University, Dr. Gardner hins published in leading recounting finner and management in jumale including The Arte Review Journal of Accounting Research Contemporary tocounting Research, Accounting Organcanons and Society Journal of Financial and Quantitate Analysis and Decision Sciences His research interests include multi-national corporation financial management, capital structure, and financial and forensic accounting Carl B. McGowan, Jr., PhD, CFA is a Professor of Finance at Norfolk State University, has a BA in International Relations (Syracuse), an MBA in Finance (Eastern Michigan), and a PhD in Business Administration (Finance) from Michigan State. From 2003 to 2004, he held the RHB Bank Distinguished Chair in Finance at the Universiti Kebangsaan Malaysia and his taught in Cost Rica, Malaysia, Moscow, Saudi Arabia, and The UAE Professor McGowan las published in numerous journals including applied Financial Economics, Decision Science Financial Practice and Education, The Financial Review International Business and Ecoceles Research Journal The International Review of Financial Analysis. The Journal of Applied Music Research. The Journal of Business Case Studies. The Journal of Duty Management. The Journal of Real Estate Research, Alamagerial Finance Mona Global Transitions. The Southwestern Economic Review, and Urban Studies Susan E. Moeller is a Professor of Finance at Eastom Michigan University since 1990. Prior to joining EMUDr. Moeller tght at Northeastern University in Boston and at the University of Michigan - Flint. Her corporate experience was with Ford Motor Company. She has published in number of journals including, Journal of Economic and Financial canon, Journal of Business Case Studies, Journal of Global Business Journal International Finance Journal of calcol Strateg, Managementencomat e Arnav plied Business Hell Journal TOT Journal of Business Case Studies - November/December 2010 Volume 6, Number 6 REFERENCES 1 2 3. 4. 5. 6. Brigham, Eugene F. and Michael C. Ehrhardt. Financial Management, Theory and Practice, Twelfth Edition, Thomson/Southwestern, Mason, OH, 2008. Damodaran, Aswath. Applied Corporate Finance." Second Edition, John Wiley&Sons, Inc., 2006, Graham, John R. and Campbell R. Harvey. "The Theory and Practice of Corporate Finance: Evidence form the Field." Journal of Financial Economics, 2002, pp. 187-243 http:obelprize.orgobel prizes/economics/laureates/1990/press.html Markowitz, Harry "Portfolio Selection," The Journal of Finance, March 1952, pp. 77-91. Ross, Stephen A., Randolph W. Westerfield, and Bradford D. Jordan. Fundamentals of Corporate Finance, Eighth Edition, McGraw-Hill Irwin, New York, 2008. William R. Sharpe, Capital Asset Prices: A Theory of Market Equilibrium under Conditions of Risk, The Journal of Finance, September 1964, pp. 425-552. Stocks, Bonds, Bills, and Inflation, Market Results for 1926 -2006, 2007 Yearbook, Classic Edition Morningstar, 2007 7. 8


