

Question
The attached Excel file, Crypto.xlsx, contains monthly Bitcoin (BITC) and Ethereum (ETH) prices as well as the corresponding TSX index level between Aug 2015 and
The attached Excel file, Crypto.xlsx, contains monthly Bitcoin (BITC) and Ethereum (ETH) prices as well as the corresponding TSX index level between Aug 2015 and Mar 2019. Please use this data to answer the following questions. Include a few lines from the file show your calculations. (a) Calculate the mean return, standard deviation and beta for BITC and ETH. (10) (b) Based on your data analysis, which cryptocurrency would you prefer to hold? Explain your thinking. (5) (c) Suppose you decide to hold an equally weighted portfolio of BITC and ETH. Compute and discuss the effects on expected return and risk, relative to your answers in (a) above. (7) (d) Finally, you have started a firm that buys crypto-currencies. The firms holdings are 55% Bitcoin, 35% Ethereum and 10% cash. Calculate measure(s) of the firms riskiness. Explain the number(s) you get. (8)
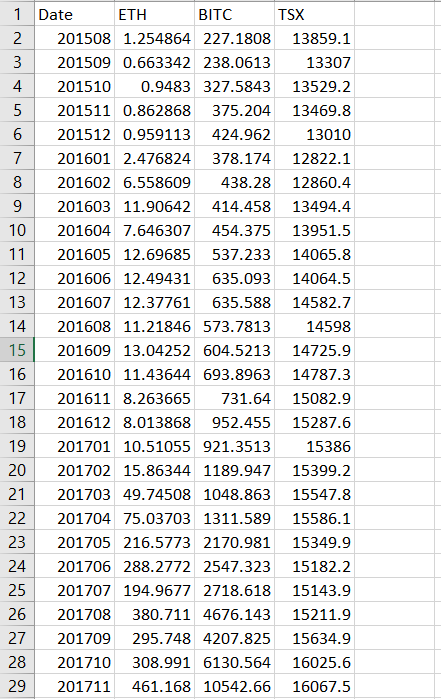
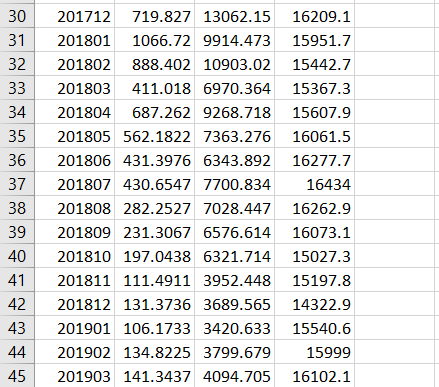
1 Date 2 201508 1.254864 227.1808 13859.1 3 201509 0.663342 238.0613 13307 4 201510 0.9483 327.5843 13529.2 5 201511 0.862868 375.204 13469.8 6 201512 0.959113 424.962 13010 7 201601 2.476824 378.174 12822.1 8 201602 6.558609 438.28 12860.4 9 201603 11.90642 414.458 13494.4 10 201604 7.646307 454.375 13951.5 11 201605 12.69685 537.233 14065.8 12 201606 12.49431 635.093 14064.5 13 201607 12.37761 635.588 14582.7 14 201608 11.21846 573.781314598 15 201609 13.04252 604.5213 14725.9 16 201610 11.43644 693.8963 14787.3 17 201611 8.263665 731.64 15082.9 18 201612 8.013868 952.455 15287.6 19 201701 10.51055 921.3513 15386 20 201702 15.86344 1189.947 15399.2 21 201703 49.74508 1048.863 15547.8 22 201704 75.03703 1311.589 15586.1 23 201705 216.5773 2170.981 15349.9 24 201706 288.2772 2547.323 15182.2 25 201707 194.9677 2718.618 15143.9 26 201708 380.711 4676.143 15211.9 27 201709 295.748 4207.825 15634.9 28 201710 308.991 6130.564 16025.6 29 201711 461.168 10542.66 16067.5 ETH BITC TSX 30 201712 719.827 13062.15 16209.1 31 201801 1066.72 9914.473 15951.7 32 201802 888.402 10903.02 15442.7 33 201803 411.018 6970.364 15367.3 34 201804687.262 9268.718 15607.9 35 201805 562.1822 7363.276 16061.5 36 201806 431.3976 6343.892 16277.7 37 201807 430.6547 7700.834 16434 38 201808 282.2527 7028.447 16262.9 39 201809 231.3067 6576.614 16073.1 40 201810 197.0438 6321.714 15027.3 42 201812 131.3736 3689.565 14322.9 43 201901 106.1733 3420.633 15540.6 44 201902 134.8225 3799.679 15999 45 201903 141.3437 4094.705 16102.1
Step by Step Solution
There are 3 Steps involved in it
Step: 1

Get Instant Access to Expert-Tailored Solutions
See step-by-step solutions with expert insights and AI powered tools for academic success
Step: 2

Step: 3
Ace Your Homework with AI
Get the answers you need in no time with our AI-driven, step-by-step assistance
Get Started
Managerial Finance
Authors: Alan Parkinson
1st Edition
0750618264, 978-0750618267