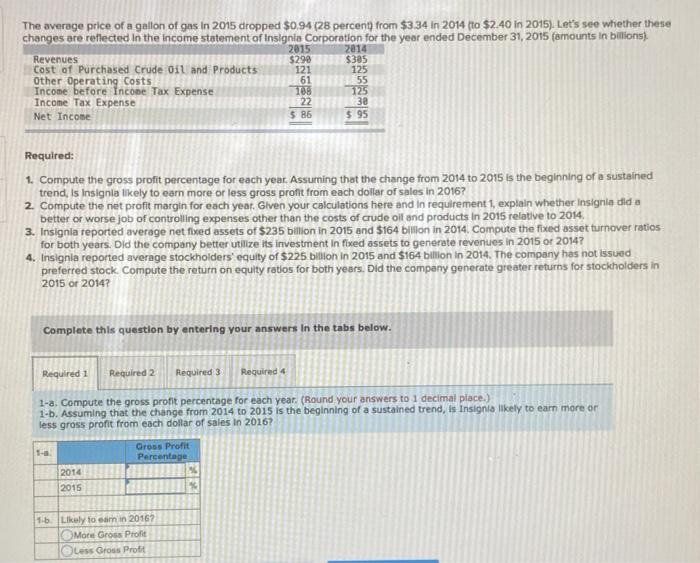
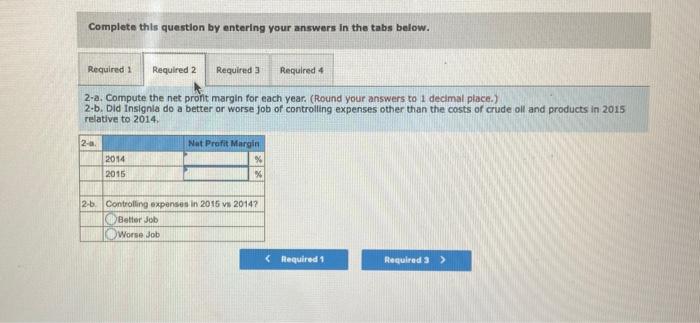
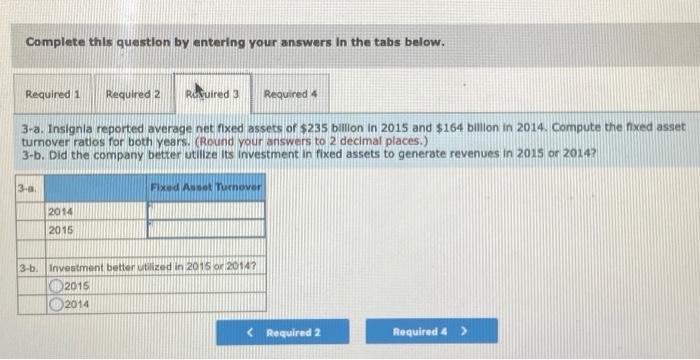
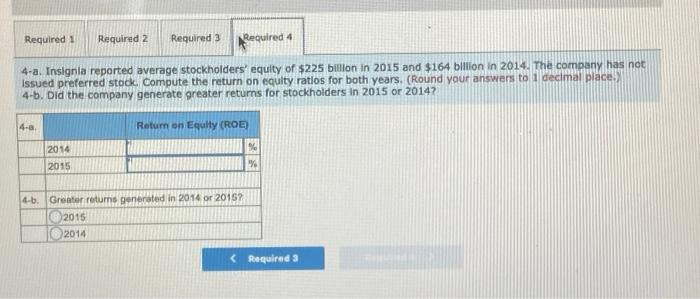
The average price of a gallon of gas in 2015 dropped $0.94 (28 percent) from $3.34 in 2014 to $2.40 in 2015). Let's see whether these changes are reflected in the income statement of Insignia Corporation for the year ended December 31, 2015 (amounts in billions) Cost of purchased Crude Oil and Products Other Operating costs Income before Income Tax Expense 125 Income Tax Expense Revenues 2015 $290 121 61 188 22 5 86 2014 $385 125 55 3a $95 Net Income Required: 1. Compute the gross profit percentage for each year. Assuming that the change from 2014 to 2015 is the beginning of a sustained trend, Is Insignia likely to earn more or less gross profit from each dollar of sales in 2016? 2. Compute the net profit margin for each year. Given your calculations here and in requirement 1, explain whether insignia dida better or worse job of controlling expenses other than the costs of crude oil and products in 2015 relative to 2014 3. Insignia reported average net fed assets of $235 billion in 2015 and $164 billion in 2014. Compute the fixed asset turnover ratios for both years. Did the company better utilize its investment in fixed assets to generate revenues in 2015 or 2014? 4. Insignia reported average stockholders' equity of $225 billion in 2015 and $164 billion in 2014. The company has not issued preferred stock. Compute the return on equity ratios for both years. Did the company generate greater returns for stockholders in 2015 or 2014? Complete this question by entering your answers in the tabs below. Required 1 Required 2 Required 3 Required 1-a. Compute the gross profit percentage for each year. (Round your answers to 1 decimal place.) 1-b. Assuming that the change from 2014 to 2015 is the beginning of a sustained trend, is insignia likely to earn more on less gross profit from each dollar of sales in 2016? Gross Profit Percentage 2014 2015 1. Likely to earn in 2016? More Gross Profit Less Gross Profit Complete this question by entering your answers in the tabs below. Required 1 Required 2 Required 3 Required 4 2-a. Compute the net pront margin for each year. (Round your answers to 1 decimal place.) 2.b. Did Insignia do a better or worse job of controlling expenses other than the costs of crude oll and products in 2015 relative to 2014 2-a. Nat Profit Margin 2014 2015 2.6. Controlling expenses in 2015 v 2014? Better Job Worse Job Complete this question by entering your answers in the tabs below. Required 1 Required 2 Refuired 3 Required 4 3-a. Insignia reported average net fixed assets of $235 billon in 2015 and $164 billion in 2014. Compute the fixed asset tumover ratios for both years. (Round your answers to 2 decimal places.) 3-b. Did the company better utilize its Investment in fixed assets to generate revenues in 2015 or 2014? 3-0 Fixed As Turnover 2014 2015 3-b. Investment better utilized in 2015 2014? 2015 2014 Required 1 Required 2 Required 3 Required 4 4-a. Insignia reported average stockholders' equity of $225 billion in 2015 and $164 billion in 2014. The company has not Issued preferred stock. Compute the return on equity ratios for both years. (Round your answers to decimal place.) 4-b. Did the company generate greater returns for stockholders in 2015 or 2014? 4-a Return on Equity (ROE) 2014 2015 4-b. Greater returns generated in 2014 or 2015 2015 2014