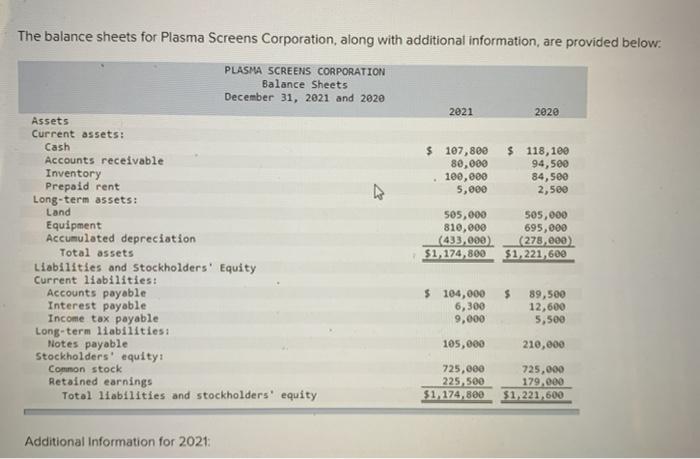
The balance sheets for Plasma Screens Corporation, along with additional information are provided below. 2021 2020 $ 107,800 80,000 180,000 5,000 $ 118,109 94,500 84,500 2,500 w PLASMA SCREENS CORPORATION Balance Sheets December 31, 2021 and 2020 Assets Current assets! Cash Accounts receivable Inventory Prepaid rent Long-term assets: Land Equipment Accumulated depreciation Total assets Liabilities and Stockholders' Equity Current liabilities: Accounts payable Interest payable Income tax payable Long-term liabilities: Notes payable Stockholders' equity: Common stock Retained earnings Total liabilities and stockholders' equity 505,000 505,000 810,000 695,000 (433,000 (278,eee) $1,174,800 $1,221,600 $ 104,000 6,300 9,000 89,500 12,600 5,500 105,000 210,000 725,000 225,500 $1,174,800 725,000 179.000 $1,221,600 Additional Information for 2021 Additional Information for 2021: 1. Net income is $74,000. 2. The company purchases $115,000 in equipment. 3. Depreciation expense is $155,000. 4. The company repays $105,000 in notes payable. 5. The company declares and pays a cash dividend of $27,500. Required: Prepare the statement of cash flows using the indirect method(List cash outflows and any decrease in cash as negative amounts.) PLASMA SCREENS CORPORATION Statement of Cash Flows For the Year Ended December 31, 2021 Cash Flows from Operating Activities Net Income 74.000 Adjustments to reconcile net income to net cash flows from operating activities Depreciation expense 155,000 Decrease in accounts receivable 14.500 Increase in inventory (15,500) Increase in prepaid rent (2.500) Increase in accounts receivable Decrease in interest payable (6.300) Increase in income tax payable 3.500 A $ 222 700 Net cash flows from operating activities Cash Flows from Investing Activities Purchase of equipment Increase in accounts receivable Decrease in interest payable Increase in income tax payable (6,300) 3,500 $ 222,700 Net cash flows from operating activities Cash Flows from Investing Activities Purchase of equipment 0 Net cash flows from investing activities Cash Flows from Financing Activities Payment of notes payable Payment of cash dividends 0 Net cash flows from financing activities Net decrease in cash Cash at the beginning of the period Cash at the end of the period $ $ 0