

Answered step by step
Verified Expert Solution
Question
1 Approved Answer
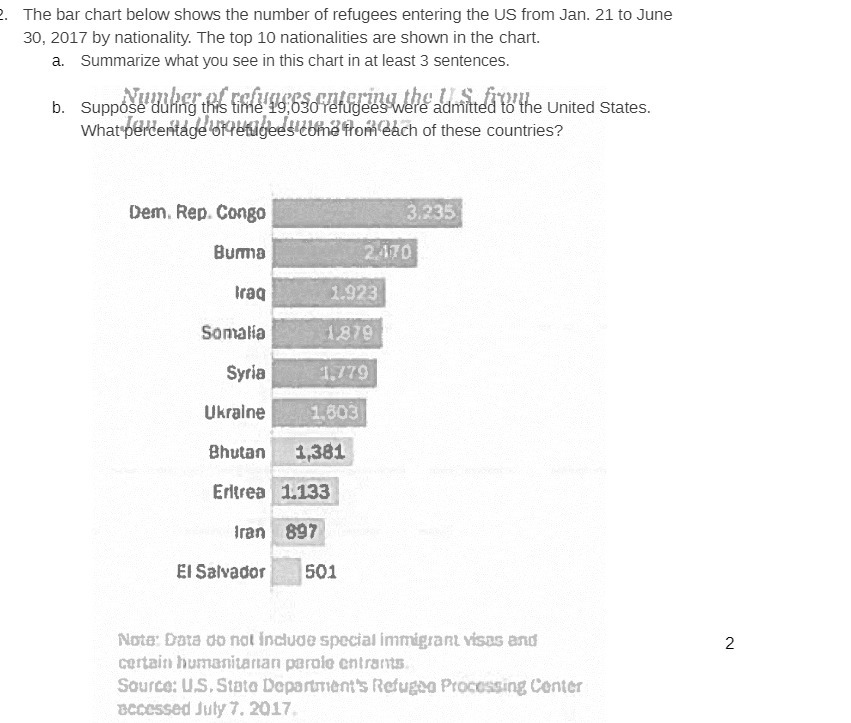
The bar chart below shows the number of refugees entering the US from Jan. 21 to June 30, 2017 by nationality. The top 10 nationalities
Step by Step Solution
There are 3 Steps involved in it
Step: 1

Get Instant Access to Expert-Tailored Solutions
See step-by-step solutions with expert insights and AI powered tools for academic success
Step: 2

Step: 3
Ace Your Homework with AI
Get the answers you need in no time with our AI-driven, step-by-step assistance
Get Started
Essential Calculus Early Transcendental Functions
Authors: Ron Larson, Robert P. Hostetler, Bruce H. Edwards
1st Edition
618879188, 618879182, 978-0618879182