Answered step by step
Verified Expert Solution
Question
1 Approved Answer
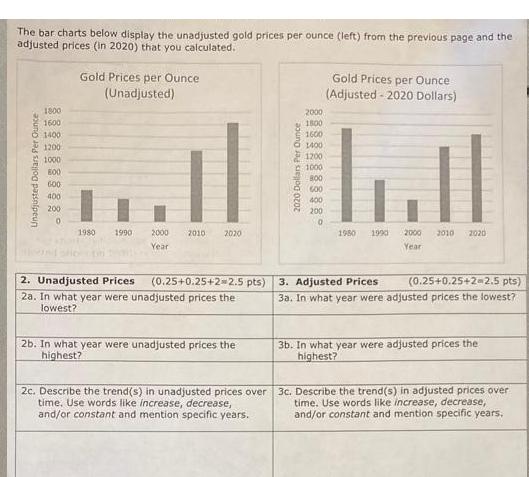
The bar charts below display the unadjusted gold prices per ounce (left) from the previous page and the adjusted prices (in 2020) that you

The bar charts below display the unadjusted gold prices per ounce (left) from the previous page and the adjusted prices (in 2020) that you calculated. Unadjusted Dollars Per Ounce 1800 1600 1400 1200 1000 800 600 400 200 0 Gold Prices per Ounce (Unadjusted) 1980 1990 2000 Year 2010 2020 2. Unadjusted Prices 2a. In what year were unadjusted prices the lowest? 2b. In what year were unadjusted prices the highest? 2000 1800 1600 1400 1200 1000 800 600 400 200 0 2c. Describe the trend(s) in unadjusted prices over time. Use words like increase, decrease, and/or constant and mention specific years. Gold Prices per Ounce (Adjusted - 2020 Dollars) (0.25+0.25+2=2.5 pts) 3. Adjusted Prices 1980 1990 2000 2010 2020 Year (0.25+0.25+2=2.5 pts) 3a. In what year were adjusted prices the lowest? 3b. In what year were adjusted prices the highest? 3c. Describe the trend(s) in adjusted prices over time. Use words like increase, decrease, and/or constant and mention specific years,
Step by Step Solution
★★★★★
3.42 Rating (155 Votes )
There are 3 Steps involved in it
Step: 1

Get Instant Access to Expert-Tailored Solutions
See step-by-step solutions with expert insights and AI powered tools for academic success
Step: 2

Step: 3

Ace Your Homework with AI
Get the answers you need in no time with our AI-driven, step-by-step assistance
Get Started


