Answered step by step
Verified Expert Solution
Link Copied!

Question

1 Approved Answer

The bar graph shows discretionary spending by full and part-time college students in some country from $140 , ,,,__.. .-, mg 0-2 2007 through 2013.
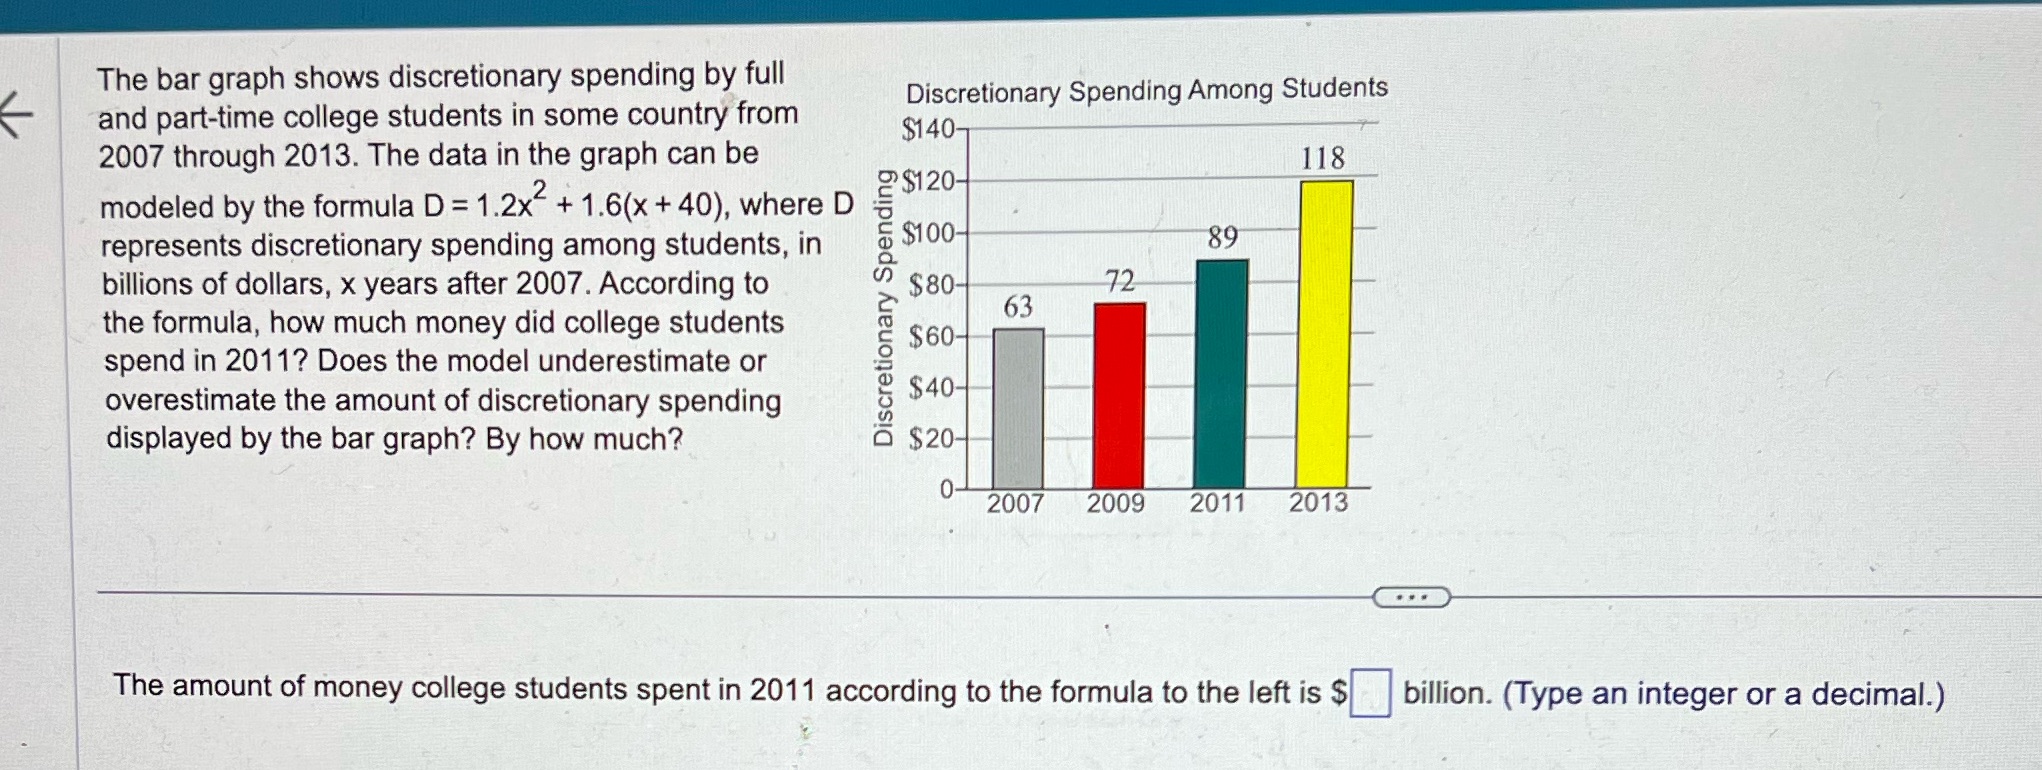
image text in transcribed
The bar graph shows discretionary spending by full and part-time college students in some country from $140 , ,,,__.. .-, mg 0-2 2007 through 2013. The data in the graph can be @3120 modeled by the formula 0 = 1.2x2 +1.6(x +40), where D 4; represents discretionary spending among students, in $1 billions of dollars, x years after 2007. According to \"g $80 the formula, how much money did college students Discretionary Spending Among Students 3 $60 spend in 2011'? Does the model underestimate or g overestimate the amount of discretionary spending 'g $40 displayed by the bar graph? By how much? 5 $20 D 2007 2009 2011 2013 E) The amount of money college students spent in 2011 according to the formula to the left is $D billion. (Type an integer or a decimal.)

Step by Step Solution

There are 3 Steps involved in it

Step: 1

blur-text-image

Get Instant Access to Expert-Tailored Solutions

See step-by-step solutions with expert insights and AI powered tools for academic success

Step: 2

blur-text-image

Step: 3

blur-text-image

Ace Your Homework with AI

Get the answers you need in no time with our AI-driven, step-by-step assistance

Get Started

Recommended Textbook for

Intermediate Accounting

Authors: Donald E. Kieso, Jerry J. Weygandt, And Terry D. Warfield

13th Edition

9780470374948, 470423684, 470374942, 978-0470423684

Students also viewed these Mathematics questions