Question
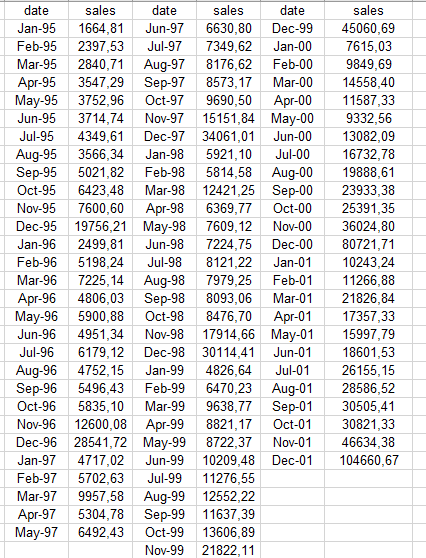
The below contains data on the monthly sales of an Australian souvenir shop over a seven-year period (Jan95-Dec01). Data were derived from Prof R. J.
The below contains data on the monthly sales of an Australian souvenir shop over a seven-year period (Jan95-Dec01). Data were derived from Prof R. J. Hyndmans Time Series Data Library and are also used in the problem set of Shmueli and Lichtendahl (2015), section 2.6.

1. Derive a set of 11 monthly dummy variables , =2,3,,12, where each takes the value 1 if the monthly index of observation is and 0 otherwise. Tip: To construct the dummies, use the Excel built-in function MONTH(.), which returns the month index of a date entry in a cell.
2. Based on the estimation data set, run the regression log()=0+12=2++ (M2) where , =2,3,,12 are the coefficients of the dummy variables (note that we have deliberately left out the January dummy in order to avoid estimation problems). Based on estimation results, answer the following questions: A. Ceteris paribus, how much on average does the logarithm of December sales deviate from January levels? B. At 5% significance, test the hypothesis that monthly sales exhibit a linear trending behavior during our sample period. 3 3.1 Compute the and of models M1 & M2 in the forecasting sample. 3.2. What is the optimal model in terms of statistical predictive accuracy? Are out-of-sample results in accordance with the ability of the models to reproduce the main features of the time series?
Step by Step Solution
There are 3 Steps involved in it
Step: 1

Get Instant Access to Expert-Tailored Solutions
See step-by-step solutions with expert insights and AI powered tools for academic success
Step: 2

Step: 3

Ace Your Homework with AI
Get the answers you need in no time with our AI-driven, step-by-step assistance
Get Started


