

Answered step by step
Verified Expert Solution
Question
1 Approved Answer
The below excel table shows the sales and the net income for XYZ Company from 2012 to 2016, use the below information to answer questions
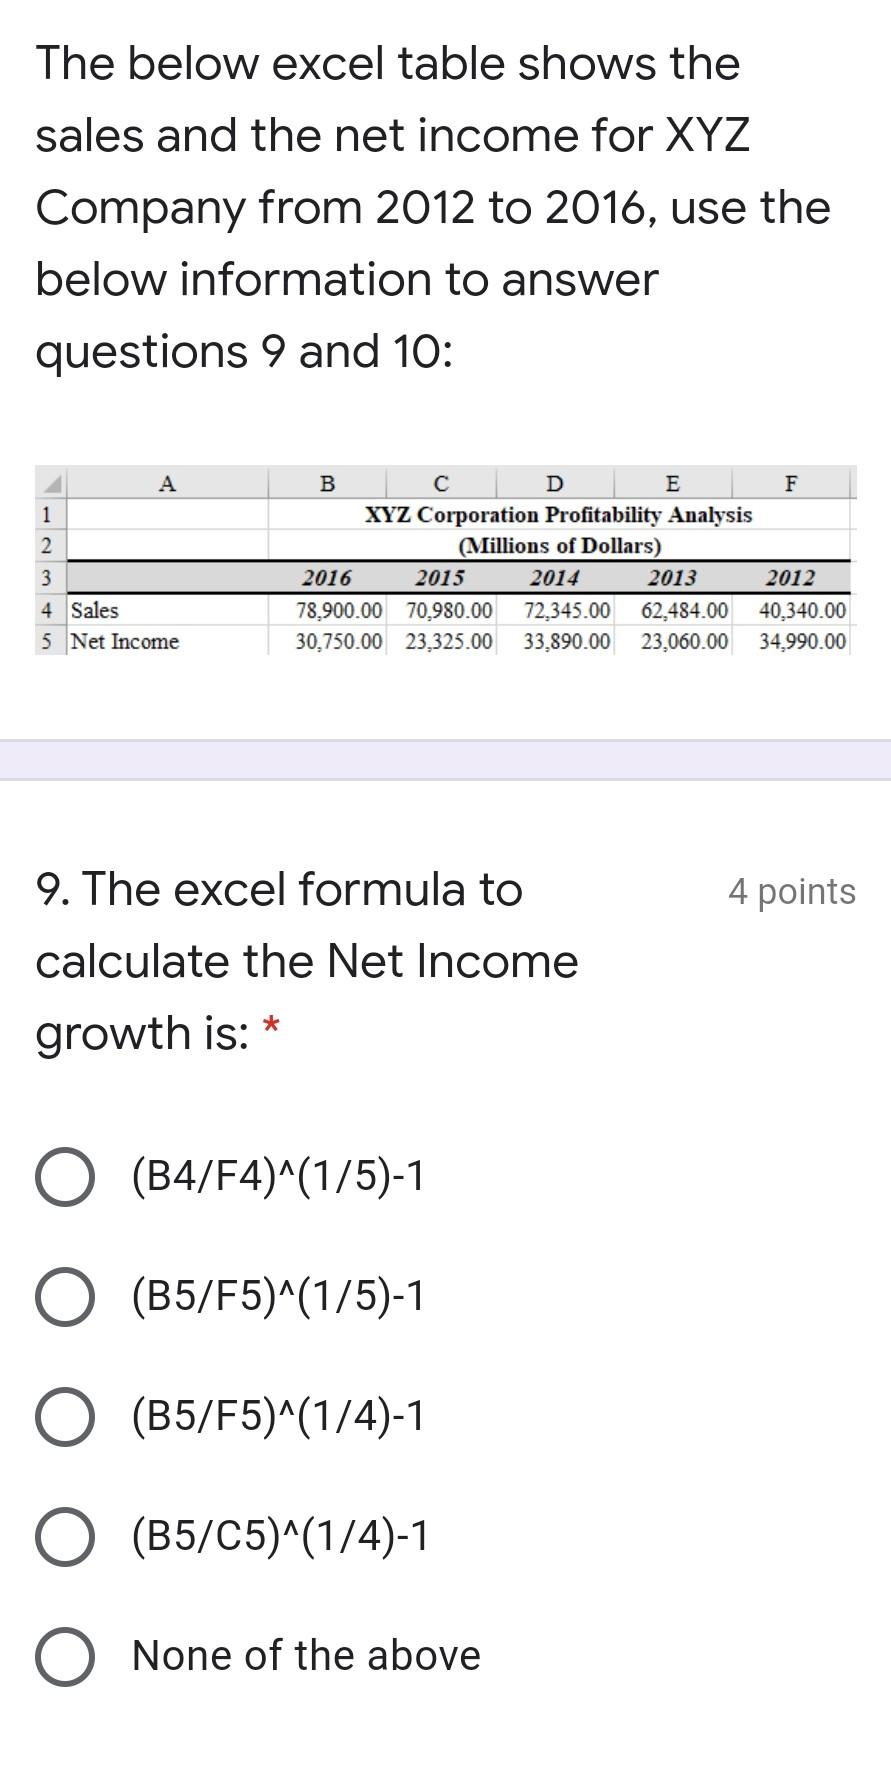
The below excel table shows the sales and the net income for XYZ Company from 2012 to 2016, use the below information to answer questions 9 and 10: 1 2 B D E F XYZ Corporation Profitability Analysis (Millions of Dollars) 2016 2015 2014 2013 2012 78.900.00 70.980.00 72,345.00 62,484.00 40,340.00 30,750.00 23,325.00 33,890.00 23,060.00 34,990.00 3 4 Sales 5 Net Income 9. The excel formula to 4 points calculate the Net Income growth is: * (B4/F4)^(1/5)-1 O (B5/F5)^(1/5)-1 (B5/F5)^(1/4)-1 O (B5/C5)^(1/4)-1 None of the above
Step by Step Solution
There are 3 Steps involved in it
Step: 1

Get Instant Access to Expert-Tailored Solutions
See step-by-step solutions with expert insights and AI powered tools for academic success
Step: 2

Step: 3
Ace Your Homework with AI
Get the answers you need in no time with our AI-driven, step-by-step assistance
Get Started
Liquidated An Ethnography Of Wall Street
Authors: Karen Ho
1st Edition
0822345994,0822391376