Answered step by step
Verified Expert Solution
Link Copied!

Question

1 Approved Answer

The below report shows NTT Industries's financial data for the past few years. 2020 2017 Year 2021 920 420 $ '000 Sales Trade receivable S
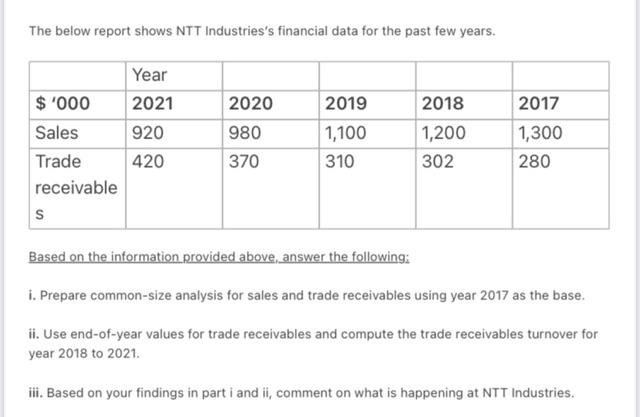
image text in transcribed

The below report shows NTT Industries's financial data for the past few years. 2020 2017 Year 2021 920 420 $ '000 Sales Trade receivable S 2018 1,200 2019 1,100 310 980 370 1,300 280 302 Based on the information provided above, answer the following: i. Prepare common-size analysis for sales and trade receivables using year 2017 as the base. ii. Use end-of-year values for trade receivables and compute the trade receivables turnover for year 2018 to 2021. ili. Based on your findings in part i and ii, comment on what is happening at NTT Industries

Step by Step Solution

There are 3 Steps involved in it

Step: 1

blur-text-image

Get Instant Access to Expert-Tailored Solutions

See step-by-step solutions with expert insights and AI powered tools for academic success

Step: 2

blur-text-image_2

Step: 3

blur-text-image_3

Ace Your Homework with AI

Get the answers you need in no time with our AI-driven, step-by-step assistance

Get Started

Recommended Textbook for

Advanced Credit Risk Analysis And Management

Authors: Ciby Joseph

1st Edition

1118604911, 978-1118604915

More Books

Students also viewed these Finance questions