

Answered step by step
Verified Expert Solution
Question
1 Approved Answer
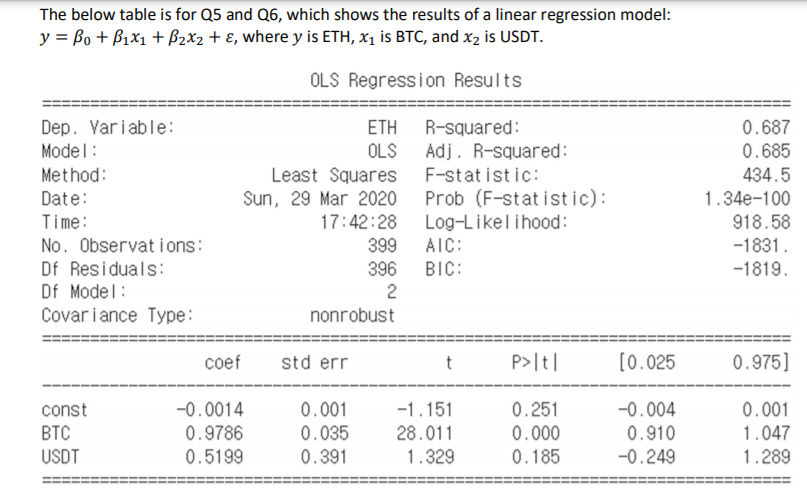
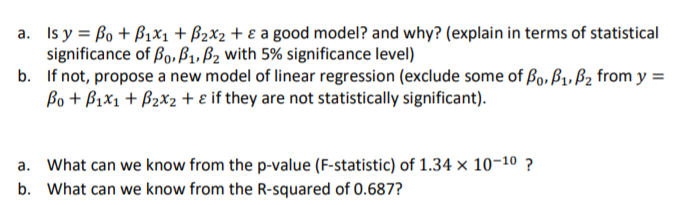
The below table is for Q5 and Q6, which shows the results of a linear regression model: y = Bo + B1X1 + B2X2 +
Step by Step Solution
There are 3 Steps involved in it
Step: 1

Get Instant Access to Expert-Tailored Solutions
See step-by-step solutions with expert insights and AI powered tools for academic success
Step: 2

Step: 3
Ace Your Homework with AI
Get the answers you need in no time with our AI-driven, step-by-step assistance
Get Started
Microsoft Visual Basic 2005 For Windows Mobile Web Office And Database Applications Comprehensive
Authors: Gary B. Shelly, Thomas J. Cashman, Corinne Hoisington
1st Edition
0619254823, 978-0619254827